Environmental Engineering Reference
In-Depth Information
80
30
5.0
Applying asymmetric daily pattern
Relative humidity
Air temperature
76
28
4.5
72
26
Applying daily mean value
68
24
4.0
64
22
3.5
60
20
56
18
3.0
52
16
14
48
2.5
Applying symmetric daily pattern
44
12
12:00 AM
24:00 PM
2.0
40
10
0.0
0.5
1.0
1.5
2.0
2.5
3.0
0.0
0.5
1.0
1.5
2.0
2.5
3.0
Time, day
Time, day
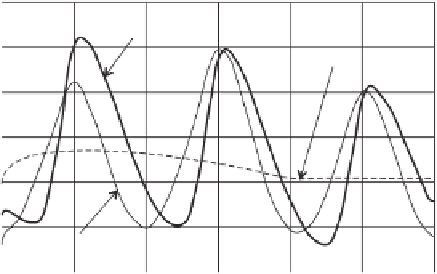
Figure 6.41
Comparison of PE calculated using different chang-
ing patterns of daily air temperature and relative humidity.
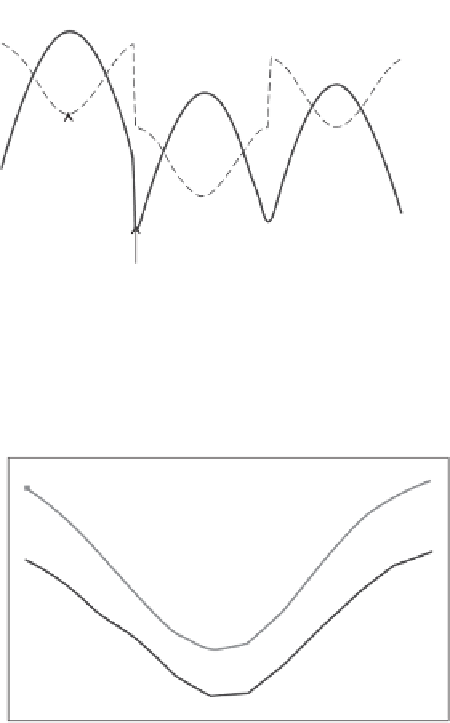
Figure 6.39
Symmetric distributions of daily changing of air tem-
perature and relative humidity based on maximum and minimum
values.
Table 6.7 Air Temperature and Relative Humidity
Used in Calculation of PE
30
Average monthly minimum
temperature, °C
Average monthly maximum
temperature, °C
25
20
15
Time
Avg.
Min.
Max.
Avg. Min. Max.
(day)
Temp.
Temp.
Temp.
RH
RH
RH
10
0
22
17
27
67
62
72
5
1
17.4
12.4
22.4
55
50
60
0
3
18.1
13.1
23.1
65
60
70
−
5
−
10
−
15
12
Cumulative PE using asymmetric air temperature and RH
Cumulative PE using symmetric air temperature and RH
Cumulative PE using average air temperature and RH
10
Figure 6.40
Monthly minimum and maximum air temperatures.
8
6
In some cases, the minimum and maximum daily air tem-
perature can be assumed when only the mean values of
air temperature are available. Figure 6.40 is an example
illustrating the change of minimum and maximum air tem-
perature with the month of a year. The average difference in
Fig. 6.40 between minimum and maximum temperature is
about 10.2
◦
C. The data are typical of the central northern
part of Canada.
Figure 6.41 illustrates the effect of using three different
daily patterns of air temperature and relative humidity on the
calculation of PE. The data shown in Table 6.7 were used in
the analysis. In Fig. 6.41, “asymmetric air temperature and
relative humidity” means the air temperature and relative
humidity are interpolated using the daily patterns shown in
Fig. 6.38. Symmetric air temperature and relative humidity
refer to the changing pattern shown in Fig. 6.39, and aver-
age air temperature and relative humidity refer to the use
of average values of air temperature and relative humidity
throughout the day, as given in Table 6.7. The calculated PE
4
2
0
0
0.5
1.0
1.5
2.0
2.5
3.0
Time, day
Figure 6.42
Comparison of cumulative PE calculated using dif-
ferent changing patterns of daily air temperature and relative
humidity.
values presented in Fig. 6.42 show slight differences when
using different daily patterns of temperature and relative
humidity; however, the cumulative PEs are quite similar for
all three patterns.
The relative humidity at the soil surface,
h
s
, and the water
vapor pressure,
u
soi
v
, at the soil surface can be calculated
using the relative humidity equation proposed by Edlefsen


Search WWH ::

Custom Search