Environmental Engineering Reference
In-Depth Information
The proposed methodologies differ mainly in the as-
sumptions related to the determination of air and soil tem-
peratures. Differences between the soil surface temperature
and the air temperature give rise to various “coupled” and
“uncoupled” moisture and heat flow formulations. The
temperature of the soil and the air generally differ; however,
the effect of the temperature difference does not appear
to have been fully studied.
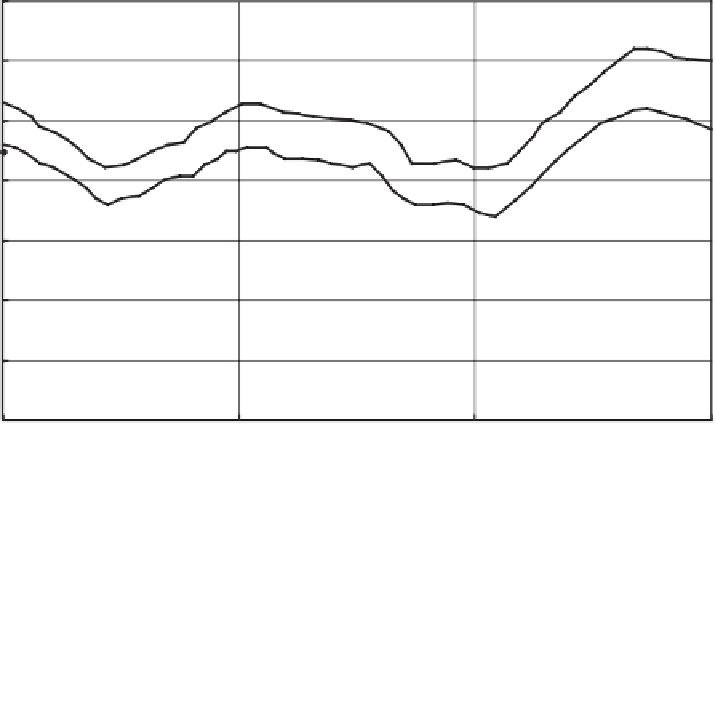
Figure 6.37 shows the temperature profiles measured near
the surface of a soil layer that was being dried by evapo-
ration. Figure 6.37a shows that the air temperature coming
into the chamber above the soil had an average tempera-
ture of about 23
◦
C. Immediately above the soil the average
temperature was about 21
◦
C. However, directly on top of
the soil layer the average measured temperature dropped to
about 17.5
◦
C. At 50mm below the soil surface the average
soil temperature was about 19
◦
C. The results show the cool-
ing effect associated with evaporation and illustrate why the
heat and moisture partial differential equations should be
coupled to represent the physical processes associated with
evaporation.
Air
50
−
50
Soil
−
150
−
250
−
350
−
450
t = 0 day
t = 5 days
t = 10 days
t = 15 days
t = 20 days
t = 25 days
t = 30 days
−
550
−
650
−
750
−
850
−
950
17
18
19
20
21
22
23
24
Temperature (
o
C)
(a)
23
Range of temperature of air
above soil surface
22
21
50 mm depth
20
19
18
Soil surface
17
16
0
10
20
30
Elapsed time (day)
(b)
Figure 6.37
(a) Temperature versus depth throughout soil layer. (b) Temperature changes result-
ing from evaporation of water from soil surface (Ta et al., 2010).


Search WWH ::

Custom Search