Environmental Engineering Reference
In-Depth Information
7
6
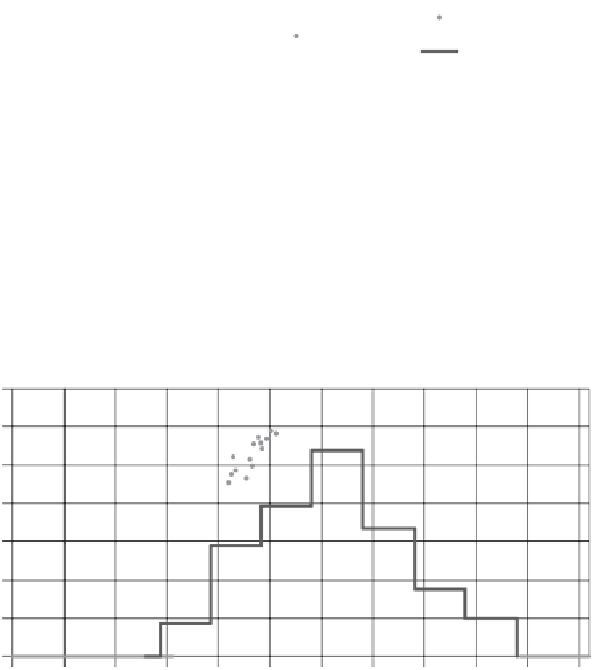
Penman PE
Thornthwaite PE
5
4
3
2
1
0
Figure 6.33
PE calculation for 2006 using Penman and Thornthwaite equations.
7
6
Penman PE
Thornthwaite PE
5
4
3
2
1
0
Figure 6.34
PE calculation for 2007 using Penman and Thornthwaite equations.
800
800
700
600
700
600
Precipitation
Precipitation
Penman PE
Penman PE
Thornthwaite PE
Thornthwaite PE
500
400
500
400
300
200
300
200
100
100
0
0
Figure 6.35
Cumulative PE calculation for 2006 using Penman
and Thornthwaite equations.
Figure 6.36
Cumulative PE calculation for 2007 using Penman
and Thornthwaite equations.
obtained from the two equations may differ from one year
to the next, as shown in Table 6.6.
The weather data at this site in northern Canada were
analyzed for a period of 14 years in order to see if there was
a consistent trend between the Penman equation calculations
and the Thornthwaite equation calculations of PE. Table 6.6
presents the cumulative PE results. The Penman equation
showed an average PE over the 14-year period of 652 mm.
The Thornthwaite equation showed an average PE of
577 mm. This means that on average the PE calculated


Search WWH ::

Custom Search