Environmental Engineering Reference
In-Depth Information
100
Net radiation component
80
60
Mixing component
40
20
0
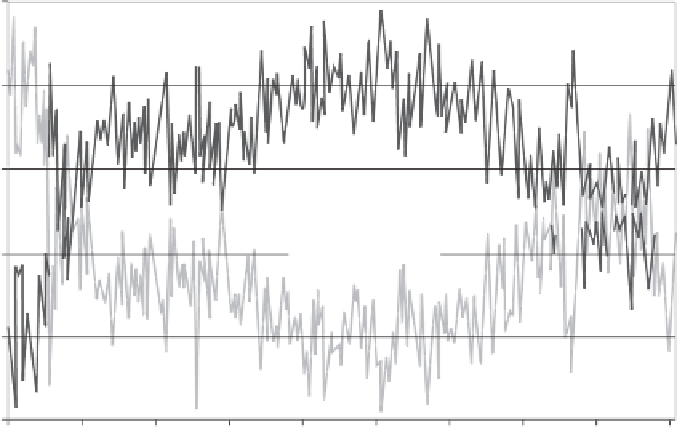
Figure 6.27
Breakdown between net radiation and mixing components of PE for the year 2005
at a site in northern Canada.
100
Net radiation component
80
60
40
20
Mixing component
0
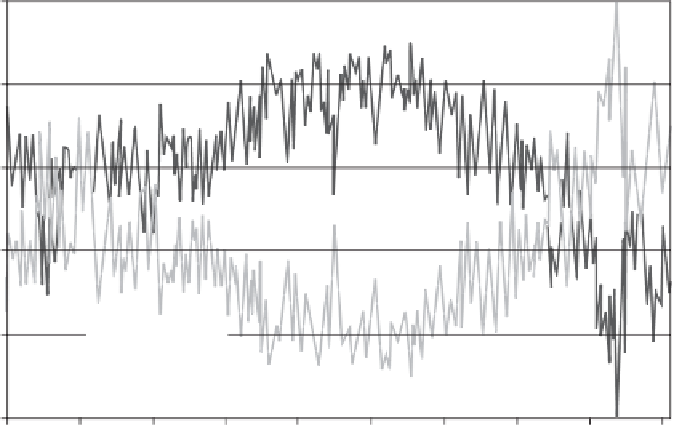
Figure 6.28
Breakdown between net radiation and mixing components of PE for the year 2006
at a site in northern Canada.
period from January to February and from November to
December. The mixing component comprised 70-100% of
total evaporation during these periods of the year. However,
it must also be noted that the total daily evaporation was
relatively small during these months.
During the months from April to October, the net radia-
tioncomponent dominates potential evaporation.Net radiation
accounted for 65-85% of total potential evaporation. During
the months from February to April and October to November
the net radiation and mixing components of evaporation are
similar with each component fluctuating between 40 and 60%.
When the total amount of potential evaporation is taken
into consideration, it is the net radiation that is the primary
contributor to total moisture flux. For the 13-year period
analyzed in Canada, net radiation contributed to most of the
total evaporative flux.


Search WWH ::

Custom Search