Environmental Engineering Reference
In-Depth Information
Hargreaves (1975) incorporated the variables—extraterre-
strial radiation, temperature, and the difference between the
mean monthly maximum and minimum temperatures—into
an equation to compute potential evaporation.
The PE calculations provide the engineer with an indica-
tion of the maximum evaporation that might be anticipated
from a water-saturated surface. As the soil at the ground sur-
face dries, it holds onto the water while the sun and wind are
pulling water skyward. The “struggle” between the climate
and the soil gives rise to the AE from the ground surface.
The contribution of each component of PE can be
computed by writing the Penman (1948) equation in the
following form. The net radiation component on potential
evaporation, PE
netrad
, is written as
6.3.9 Use of Penman (1948) Equation for Calculating
Potential Evaporation
The vapor pressure in the air above the water and the satu-
rated vapor pressure at the water surface are the dominant
variables driving evaporation. The saturated vapor pressure
is a function of temperature while the actual vapor pressure
in the air is related to relative humidity. The two variables on
the bottom of the Penman (1948) equation are also related
to the physical properties of water vapor.
It is generally assumed that it is not sufficient to use
average daily values for variables such as temperature and
relative humidity when solving the Penman (1948) equation.
Rather, minimum and maximum values for each day are
used to provide an improved calculation of the changes in
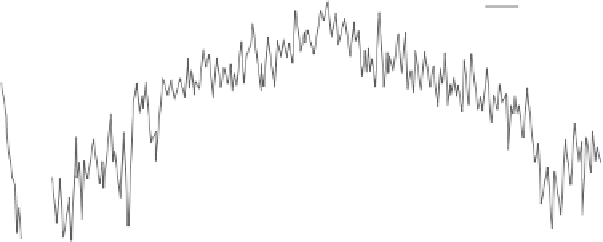
vapor pressure in the air throughout each day. Figure 6.23
shows the minimum, maximum, and average air temper-
ature readings at a particular site in Canada for the year
2007. Figure 6.24 shows the minimum, maximum, and aver-
age relative humidity values for the same site in the same
year. Minimum, maximum, and average values can be used
to approximate the nonlinear variation in vapor pressure
throughout each 24-h day.
Figure 6.25 shows a plot of wind speed and Fig. 6.26
shows a plot of the net radiation for each day at a particular
site. Net radiation values are not always measured at weather
stations, and therefore it is sometimes necessary to estimate
net radiation values based on the latitude of the site under
consideration as well as other variables.
Q
n
PE
netrad
=
(6.24)
+
η
and the mixing component, PE
mixing
, is written as
ηE
a
PE
mixing
=
(6.25)
+
η
Equations 6.24 and 6.25 allow the separation of the evap-
orative moisture flux due to net radiation and that due to
mixing when using the Penman (1948) equation. Calcula-
tions are presented for a typical climate in northern Canada.
The analysis of the weather data for the years 2005 and 2006
are shown in Figs. 6.27 and 6.28. The total evaporative flux
can vary significantly from one day to the next; however,
the figures show the portion of total evaporation for each
day that is due to each of the components of potential evap-
oration. The climate at the site under consideration can be
classified as perhumid to moist humid during the fall and
spring period and as semiarid to arid during the summer
period from April to October.
The calculations from all years showed that the mixing
component of potential evaporation dominated during the
40
Maximum
30
Mean
20
Minimum
10
0
−
10
−
20
−
30
−
40
Figure 6.23
Minimum, maximum, and average air temperature readings for a particular site in
the year 2007.


Search WWH ::

Custom Search