Environmental Engineering Reference
In-Depth Information
climate classification system in 1931. The classification
system was revised in 1948 and it is the latter climate
classification system that is generally used in geotechnical
engineering. The climate near a site under consideration can
be classified based on average temperature and precipitation
measurements. Temperature along with global setting (i.e.,
latitude) is used to estimate PE. Potential evaporation is pri-
marily driven by average temperatures (or more accurately
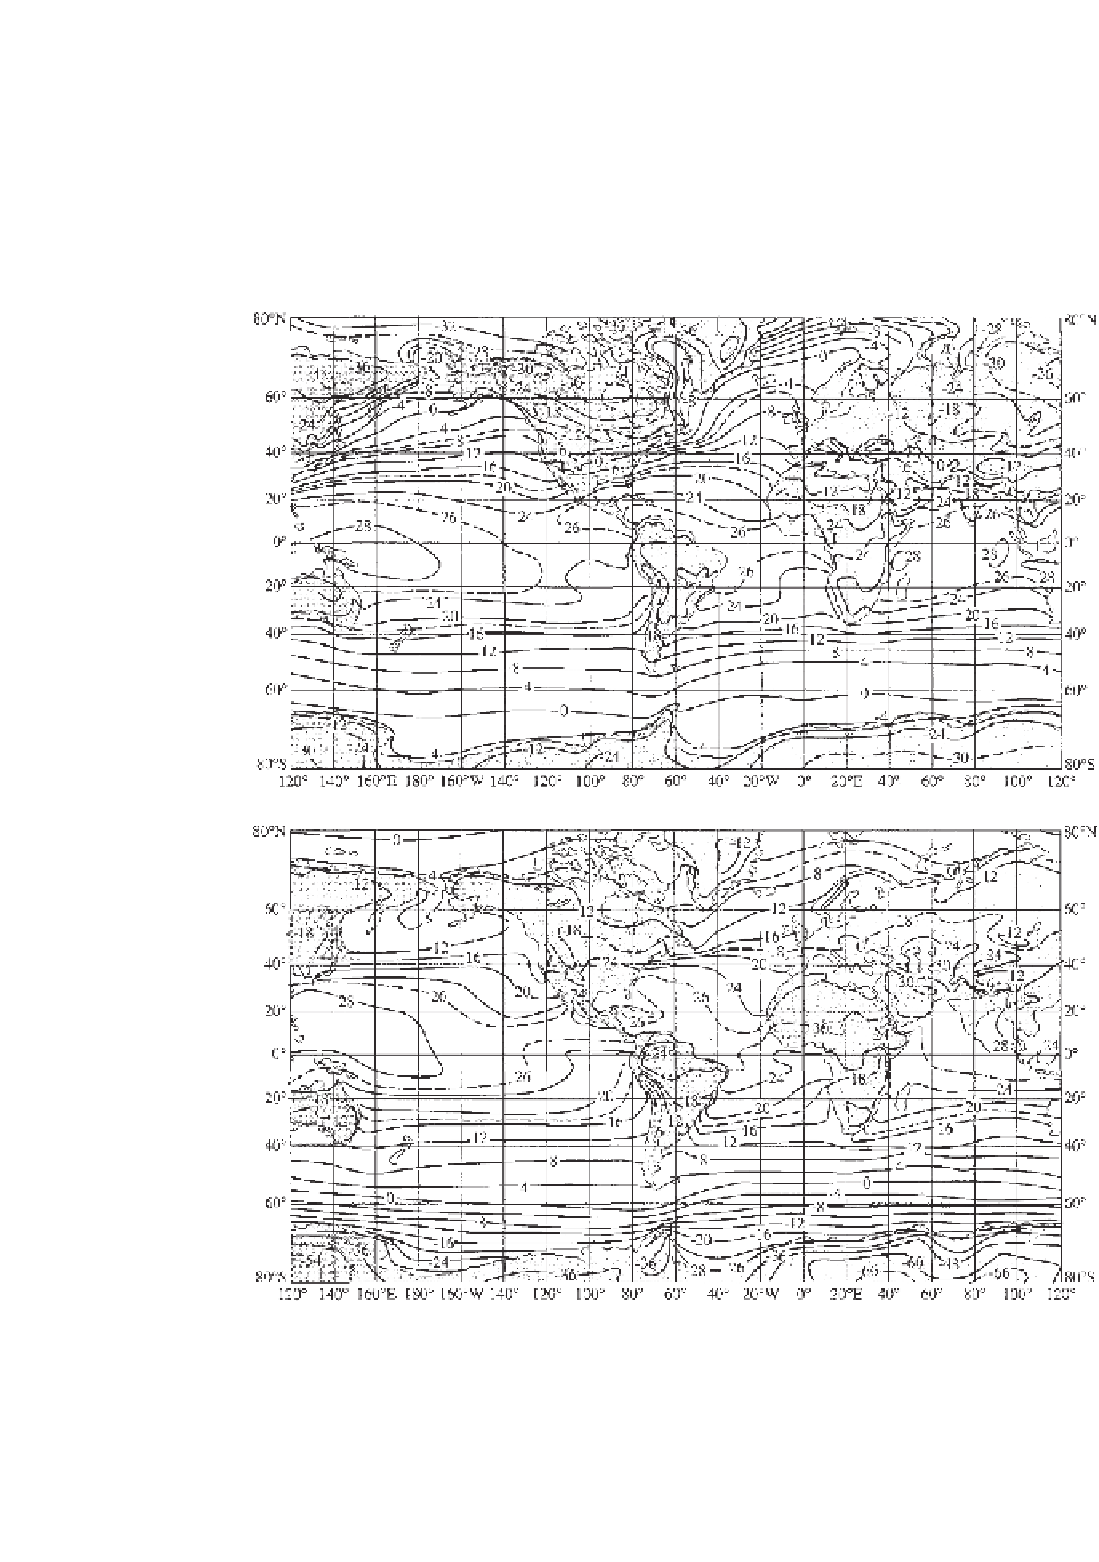
by net radiation). Figure 6.2 shows temperature contours
for the world for 2 months of the year. Figure 6.2a shows
the mean global temperatures for January and Fig. 6.2b
shows the mean global temperatures for July. Similar plots
can be made for each month of the year. Figure 6.3 shows
average precipitation contours for the world for the 12
months of the year. It is also possible to plot the monthly
average precipitation values.
Thornthwaite (1948) developed a classification system for
climate based on the calculation of a moisture index
I
m
that
takes into consideration the total annual precipitation and the
annual potential evapotranspiration. In 1948 it was assumed
that the water surplus from one season might be carried
forward to another season and therefore a weighting factor
(a)
(b)
Figure 6.2
Temperature is the primary factor controlling the evaporative flux from the earth's
surface. (a) Mean temperatures for January. (b) Mean temperatures for July. From
The Physics of
Climate
, by J. P. Peixoto and by A.H. Oort
© 1992, used with permission of American Institute
of Physics.


Search WWH ::

Custom Search