Environmental Engineering Reference
In-Depth Information
120
Predicted SWCC based on
D
60
100
80
60
D
60
= 0.1 mm
40
20
D
60
= 1 mm
0
10
6
0.1
1
10
100
1000
10,000
100,000
Matric suction, kPa
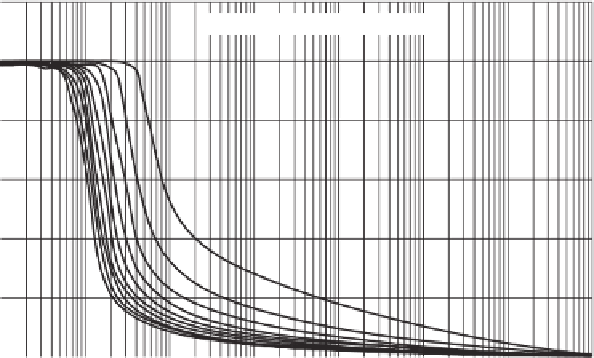
Figure 5.119
Family of SWCCs for nonplastic soils based on Zapata (1999) model when using
D
60
as representative particle size.
Predicted SWCC based on
w
p
PI
100
80
w
p
PI = 50
40
30
60
20
15
10
3
40
w
p
PI = 0.1
20
0
10
6
0.1
1
10
100
1000
10,000
100,000
Matric suction, kPa
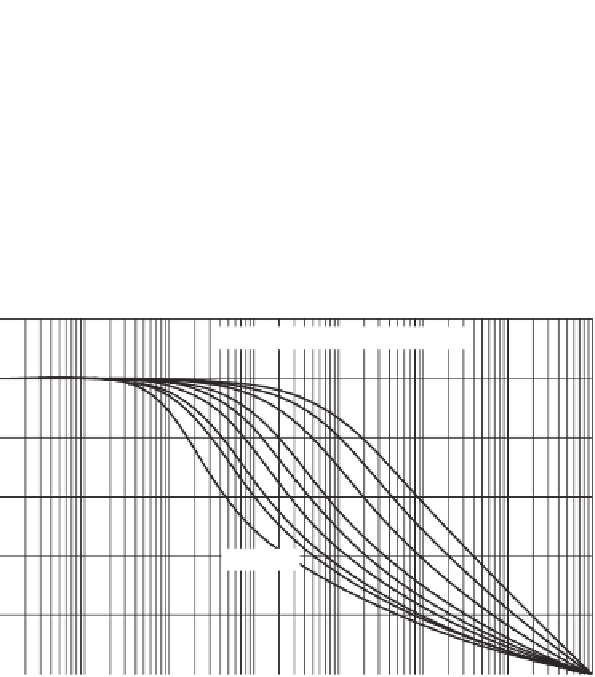
Figure 5.120
Family of SWCCs for plastic soils based on the Zapata (1999) model when using
w
p
PI as the correlation parameter.
5.14.4 Estimated Desorption SWCC for all Soils
(Zapata, 1999)
The families of SWCCs can be combined and presented as
shown in Fig. 5.121. All SWCCs converge at a soil suction
value of 10
6
kPa. It should be noted that the family of curves
shown in Fig. 5.121 are the average of many test results.
These curves provide an indication of anticipated results
but should not be viewed as a replacement for the measure-
ment of the SWCC in the laboratory. It is reasonable to use
the family of curves based on the Zapata (1999) correlation
study along with the pedo-transfer from grain-size distribu-
tion curves at the preliminary design stage in order to obtain
a crude approximation of the SWCC for a particular soil. It
is advocated that the SWCC be measured in the laboratory
as part of the final design stage of engineering.
5.14.5 Torres (2011) Model for Granular Materials
Torres (2011) analyzed a database of about 4500 granular
soils and found that the
D
10
particle size produced improved
correlation coefficients to those obtained when using the
D
60
particle size. The correlation coefficients were obtained for
the Fredlund and Xing (1994) SWCC equation. The corre-
lation for the
a
f
fitting parameter was represented by the
following equation:
967
.
2
D
10
+
a
f
=−
218
.
4
D
10
−
2
.
70
(5.105)


Search WWH ::

Custom Search