Environmental Engineering Reference
In-Depth Information
7
25
6
20
5
15
4
10
3
5
2
0
1
0
0
0.2
0.4
0.6
0.8
1.0
0.2
0.4
0.6
0.8
1.0
Fredlund PTF error,
R
2
Scheinost error,
R
2
(a)
(b)
20
5
15
4
3
10
2
5
1
0
0
0
0.2
0.4
0.6
0.8
1.0
0
0.2
0.4
0.6
0.8
1.0
Arya error,
R
2
Rawls error,
R
2
(c)
(b)
7
7
6
6
5
5
4
4
3
3
2
2
1
1
0
0
0.2
0.4
0.6
0.8
1.0
0
0.2
0.4
0.6
0.8
1.0
Vereecken error,
R
2
Tyler error,
R
2
(e)
(f)
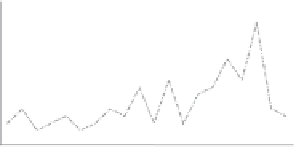
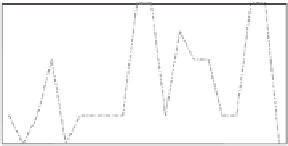
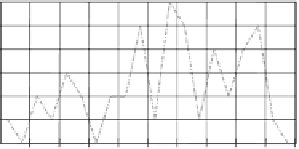
Figure 5.111
Comparison of frequency distribution of
R
2
for values between 0.0 and 1.0 for
six PTFs.
Determination of SWCC
Laboratory
measurement of
water content versus
suction
SWCC predictions
from the grain-size
distribution
(GSD)
SWCC parameters
correlated with grain-
size distribution and
Atterberg limits
Dataset mining for
typical SWCC
Pressure plate
apparatus
<1500 kPa
Vacuum
desiccators
>1500 kPa
Numerous
models
Parameters for
numerous models
Soils with
similar grain-
size distribution
Soils with
similar soil
classification
Figure 5.112
Methodologies for determination of SWCC.
5.13 TWO-POINT METHOD
OF ESTIMATING SWCC
completely saturated conditions under zero suction (i.e., sat-
urated water content) and completely dry conditions (i.e.,
zero water content and a soil suction of 10
6
). The SWCC
can either be measured or estimated using one of several
available techniques. The final intent is to arrive at an appro-
priate representation of the air-entry value and the residual
conditions for each soil involved in the engineering problem
at hand.
Let us consider a soil that does not undergo volume change
as soil suction is increased. In this case, the SWCC has two
primary defining points: (1) the water content and soil suction
at the air-entry value for the soil and (2) the water content
and soil suction at residual conditions. There are also two
additional points that define the extreme limits on the SWCC:


Search WWH ::

Custom Search