Environmental Engineering Reference
In-Depth Information
Table 5.10 Values of Alpha Proposed
by Arya et al. (1981)
predict although the estimation algorithm still appears quite
reasonable. The predicted SWCCs tend to be sensitive to
the packing porosity
n
p
.
TheM.D. Fredlund (2000) pedo-transfer function was com-
pared to five other pedo-transfer functions. Results of the com-
parisons between the measured and estimated air-entry values
indicated significant improvement when using the M.D. Fred-
lund (2000) pedo-transfer function over other methods. The
M.D. Fredlund (2000) pedo-transfer function and the Arya
and Paris (1981) methods showed the highest level of con-
fidence in estimating the air-entry value of a soil. The M.D.
Fredlund (2000) pedo-transfer function showed reasonable
accuracy in estimating the maximum slope of the SWCC.
USDA Texture
α
Sand
1.285
Sandy loam
1.459
Loam
1.375
Silt loam
1.15
Clay
1.16
a
Dimensionless.
5.12.16 Other Procedures for Estimating SWCC
The grain-size distribution curves for a soil can be used in
other ways to select an approximate SWCC. It is possible to
use the classification of a soil when searching a database of
test results for an appropriate SWCC (M.D. Fredlund et al.,
1996). Figure 5.112 illustrates approaches that can be used
to obtain an SWCC. The approaches range from the direct
measurement of the SWCC to its estimation from classifi-
cation soil properties. Figure 5.113 further categorizes some
of the estimation procedures that can be used to obtain an
estimated SWCC. The estimated SWCC can subsequently
be used for the determination of unsaturated soil property
functions.
The classification soil properties and previously measured
SWCCs can be incorporated into a knowledge-based
database to assist users in estimating a reasonable SWCC.
Correlations between classification soil properties (e.g.,
grain-size distribution and Atterberg limits) can provide
approximate parameters for SWCC equations. The estimated
SWCCs are satisfactory for many engineering applications
(Aubertin et al., 2003; Zapata et al., 2000).
general, the method performs well for the estimation of
desaturation rates.
Tyler and Wheatcraft (1989).
Tyler and Wheatcraft
(1989) use a fractal dimension to estimate the Arya and
Paris (1981)
α
input parameter. The fractal dimension is
calculated through the use of a linear regression analysis
over particles associated with the grain-size fractions. The
method does not appear to improve on the performance of
the Arya and Paris (1981) estimation.
5.12.15 Summary Comments on the Pedo-Transfer
Estimation Models
A statistical analysis study appears to show that the Fred-
lund (1997) PTF performed reasonably well. A compari-
son of the frequency distribution for six PTFs is shown in
Fig. 5.111. The bell-shaped frequency response indicates
a positive predictive method. The estimation of an SWCC
from a grain-size distribution has been found to give rea-
sonable approximations for sands and silts. The SWCC for
clays, tills, and well-graded fine soils are more difficult to
50
Silty clay loam
Silty clay loam PTF
Loam
Loam PTF
Sand
Sand PTF
Sandy loam
Sandy loam PTF
Silt loam
Silt loam PTF
40
30
20
10
0
10
6
0.01
0.1
1
10
100
1000
10,000
100,000
Soil suction, kPa
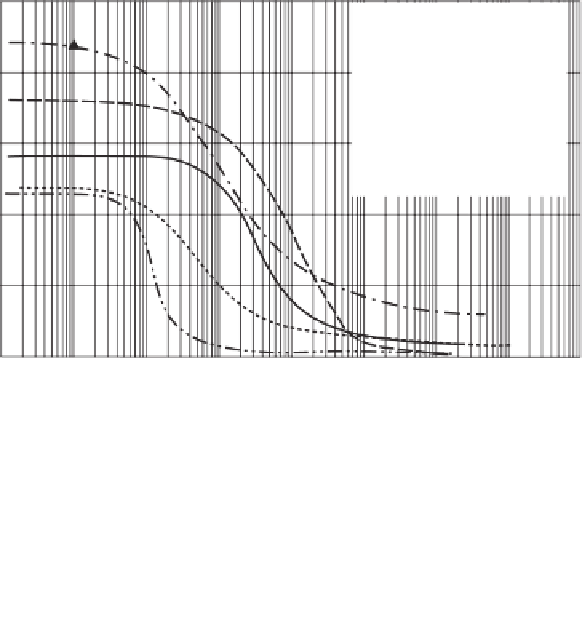
Figure 5.110
Best estimation of SWCC for five soil textures using Arya and Paris (1981)
pedo-transfer function: silty clay, loam, sand, sandy silt, silt.


Search WWH ::

Custom Search