Environmental Engineering Reference
In-Depth Information
30
Flat curve (clay)
n
f
= 0.2,
m
f
= 1.9
20
Step curve (sand)
n
f
= 10,
m
f
= 0.8
10
0
10
6
0.1
1
10
100
1,000
10,000
100,000
Soil suction, kPa
Figure 5.101
Variation of parameters
n
f
and
m
f
according to particle-size diameter while
holding
a
f
constant at 100 kPa (from Fredlund, 1997b).
30
20
Coarse sand
Clay
10
0
10
6
0.1
1
10
100
1000
10,000
100,000
Soil suction, kPa
Figure 5.102
Assumed limits for SWCCs for uniform coarse sand (
a
f
=
1
,n
f
=
20,
m
f
=
2
,h
r
=
3000) and a clay (
a
f
=
100
,n
f
=
1
,m
f
=
0
.
5
,h
r
=
3000)
(from Fredlund,
1999b).
5.12.11 Designation of Porosity and Packing
Arrangement for M.D. Fredlund (2000) Model
The grain-size distribution curve can be divided into
n
frac-
tions of uniform sized particles. Each fraction has a packing
arrangement and porosity. The summation of the individ-
ual fraction porosity values may be greater than the overall
porosity of the combined soil fractions. In the assemblage of
soil particles, the voids created between larger particles will
be filled with smaller particles. Consequently, the influence
of the larger particles on the SWCC is reduced (Yazdani
et al., 2000). The porosity of the individual fractions can
be summed until the overall porosity of the soil is reached.
After this point the remaining particle fractions are ignored.
The “packing” porosity
n
p
for each uniform particle size
needs to be approximated. It can be assumed that the
n
p
100
USCS % silt
80
Experimental
Fredlund unimodal
60
USCS
% clay
Particle sizes
40
USCS
% sand
20
0
0.001
0.01
0.1
1
10
100
Particle size, mm
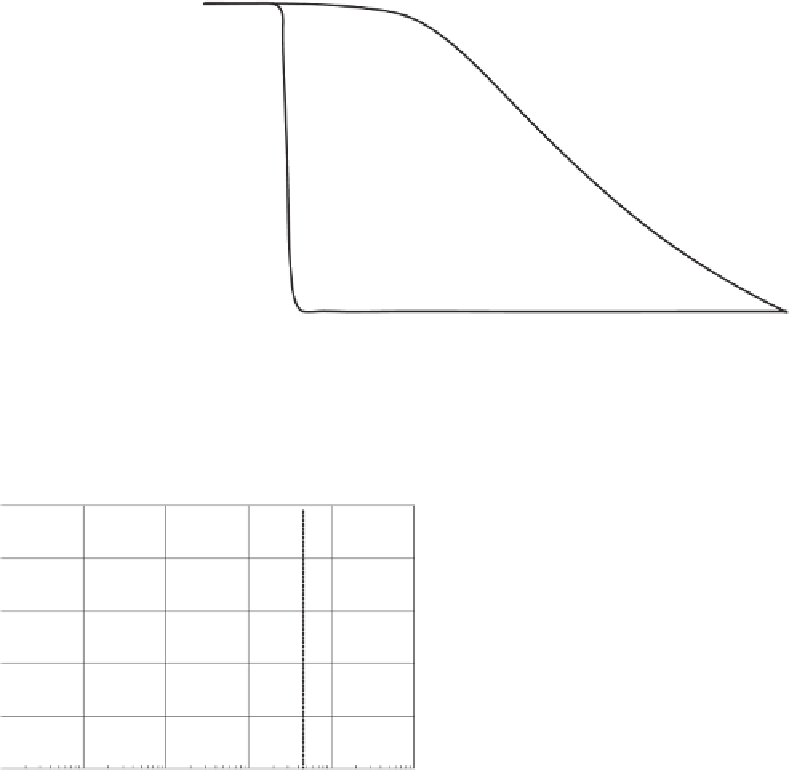
Figure 5.103
Small divisions of particle sizes used to build over-
all SWCC.


Search WWH ::

Custom Search