Environmental Engineering Reference
In-Depth Information
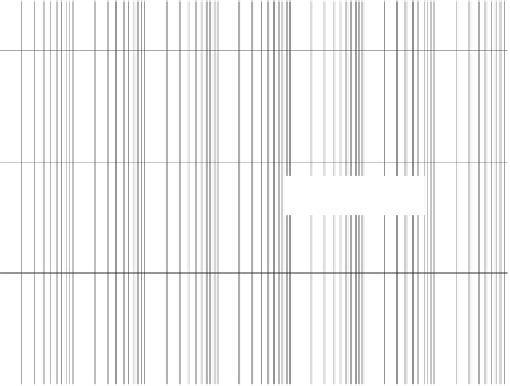
30
20
Silt from
Vereecken (1989)
10
Sand from Dane
et al. (1983)
0
10
6
0.1
1
10
100
1,000
10,000
100,000
Soil suction, kPa
Figure 5.49
Desorption SWCC data for sand (data from Dane and Hruska, 1983) and silt (data
from Vereecken et al., 1989).
is considerably different from that of a low-volume-change
soil. A highly plastic clay (i.e., Regina clay) was prepared in
an initial slurry state (i.e., slurry water content of 88%) and
then preconsolidated to various pressures. The test results on
the preconsolidated clay are used to illustrate the interpre-
tation of SWCC data on a high-volume-change soil. There
are changes in the amount of water in the soil (i.e.,
dw
or
d
θ
or
dS
) and also changes in overall volume (i.e.,
de
or
dn
or
dv
where
n
is porosity and
v
is specific volume).
The liquid limit of Regina clay is 75%, the plastic limit is
25%, and the soil has 50% clay size particles. Figure 5.50
shows the gravimetric water content versus soil suction plot
for Regina clay soil specimens that were preconsolidated
to 6.2 and 400 kPa. The initial saturated water content of
the soil specimen preconsolidated to 6.2 kPa was 70% and
the water content of the soil specimen preconsolidated to
400 kPa was 56%. The preconsolidated specimens show a
gradual curvature onto the virgin compression branch for the
soil as soil suction is increased. The curves lack a distinct
break in curvature common to specimens loaded in one-
dimensional compression. Fredlund (1964) observed that the
gradual curvature of the SWCC onto the virgin compres-
sion branch is probably due to the three-dimensional volume
change during suction change and is certainly not related to
the air-entry value of the soil. Figure 5.51 shows a shrinkage
curve for the same soil and Fig. 5.52 shows a plot of degree
of saturation versus water content for specimens of Regina
clay. Both plots show that the soil begins to desaturate near
the plastic limit of the soil (i.e., 25%). The soil suction at
the plastic limit is close to the limiting suction that can be
applied in the pressure plate apparatus (i.e., about 1500 kPa).
The above information can be cross-plotted to give two
additional graphs of the volume-mass soil properties versus
soil suction. A plot of void ratio
e
versus soil suction yields
Figure 5.50
Gravimetric water content versus soil suction for Regina clay prepared at two
preconsolidation pressure values (from Fredlund, 1964).


Search WWH ::

Custom Search