Environmental Engineering Reference
In-Depth Information
1.2
Frequency
Integration of the
distribution
1.0
0.8
0.6
0.4
0.2
0
0.1
1
10
100
Soil suction, kPa
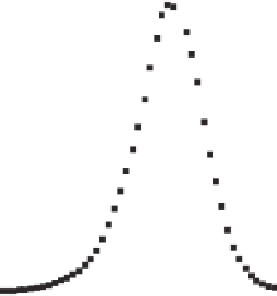
Figure 5.21
Pore-size distribution function along with corresponding integration function for
soil with little water storage in high-suction range.
1.0
0.8
Frequency
Integration of the
distribution
0.6
0.4
0.2
0
0.1
1
10
100
Soil suction, kPa
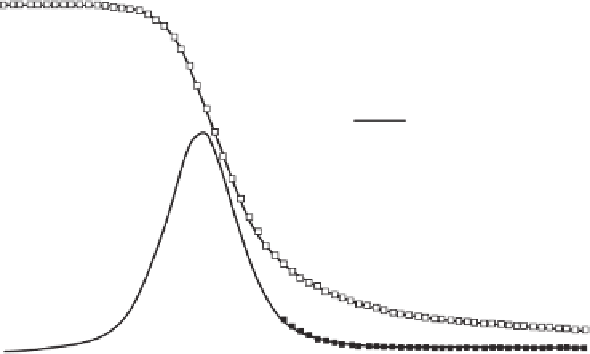
Figure 5.22
Pore-size distribution function along with integration function for soil where water
storage does not drop to zero in high-suction range.
where:
Figure 5.25 indicates that parameter
n
f
controls the slope
of the SWCC. The slope or differential of Eq. 5.48 attains its
maximum value approximately at the value of
a
f
. Therefore,
the point
(a, θ(a
f
))
can be used as the inflection point. A
graphical estimation for the three parameters can be obtained
from the SWCC. First, locate the inflection point
(ψ
i
,θ
i
)
on
the SWCC plot and draw a tangent line through this point
(Fig. 5.26). Let
s
denote the slope of the tangent line. The
three parameters
a
f
,n
f
, and
m
f
can then be determined
as follows:
a
f
,n
f
,m
f
=
three fitting parameters,
θ
=
volumetric water content corresponding to
a selected soil suction,
θ
s
=
saturated volumetric water content, and
e
=
irrational constant equal to 2.71828.
Figures 5.23-5.25 show the effect of varying each of the
three parameters
a
f
,n
f
, and
m
f
on the shape of the SWCC.
Figure 5.23 shows that when
n
f
and
m
f
are fixed, the
a
f
parameter (with units of kPa), is related to the air-entry
value. In general, the value for the parameter
a
f
is higher
than the air-entry value. However, for small values of
m
f
,
the air-entry value is close to the parameter
a
f
.
Figure 5.24 shows that when
a
f
and
n
f
are fixed, the
m
f
parameter provides independent curvatures in the low- and
high-suction ranges.
a
f
=
ψ
i
(5.49)
3
.
67 ln
θ
s
θ
i
m
f
=
(5.50)
1
.
31
m
+
1
m
f
θ
s
n
f
=
3
.
72
sψ
i
(5.51)


Search WWH ::

Custom Search