Environmental Engineering Reference
In-Depth Information
to be expanded and the high-suction range needs to be
compressed, and consequently, a logarithmic scale is suit-
able for plotting laboratory results. It has become acceptable
practice to plot matric suction in the lower soil suction range
of the SWCC (e.g., up to approximately 1500 kPa). Above
1500 kPa it has become acceptable practice to plot total suc-
tion when graphing SWCC data.
It is the test procedures used when measuring soil suction
that indicatewhether matric or total suction is beingmeasured.
A change has been made from matric suction to total suction
along the abscissa. There is an apparent inconsistency in the
soil suction variables that are plotted, but the practice has
worked quite well for most geotechnical engineering applica-
tions. Most geotechnical engineering processes are associated
with either matric suction in the lower suction range (e.g.,
permeability and shear strength) or total suction in the higher
suction range (e.g., actual evaporation).
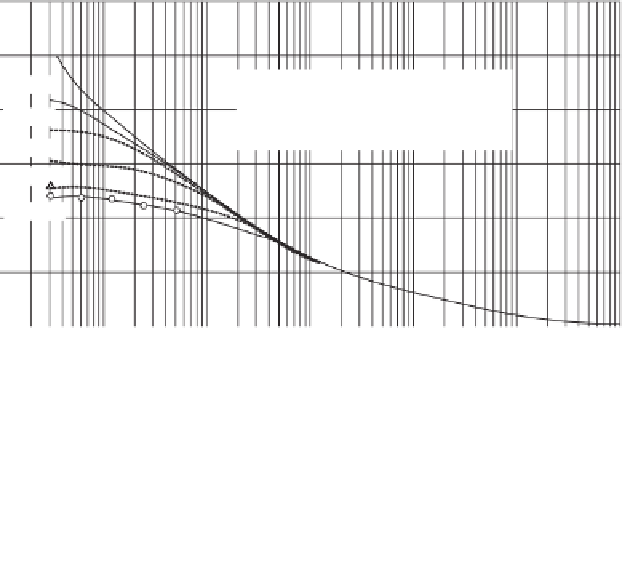
Laboratory desorption data for highly plastic clay (i.e.,
Regina clay with LL
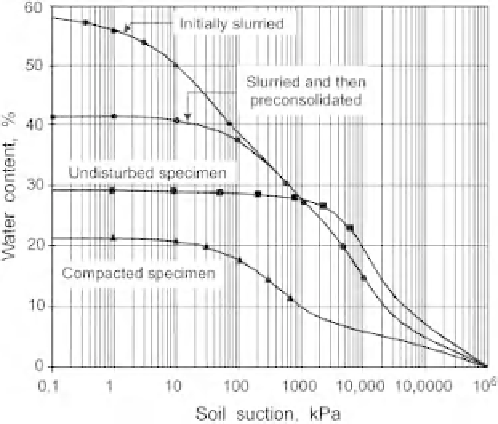
Figure 5.10
Effect of stress history and method of specimen
preparation on measured SWCC.
25%) are used to
illustrate the influence of high volume changes as soil suction
is increased. The clay soil was initially placed in a slurry
state and then consolidated to various pressures, as shown
in Fig. 5.11. The components of soil suction when the clay
is consolidated to 6.2 and 400 kPa is shown in Fig. 5.12.
The difference between using gravimetric water content and
degree of saturation for the interpretation of the test results
on a highly compressible clay soil is shown in Fig. 5.13.
The results show that while there is a yield point related
to the preconsolidation pressure of the soil (e.g., about
400 kPa), the air-entry value is approximately 1500 kPa for
the highly plastic soil prepared as a slurry. The Regina clay
soil shows a consistent air-entry value of about 1500 kPa
as long as the preconsolidation pressure is lower than the
air-entry value.
The desaturation of a soil is commonly divided into three
main zones: boundary effect zone,
=
75% and PL
=
for consistency between measurements of the SWCC in the
laboratory and the theoretical requirements of derived partial
differential formulation. The results of a numerical model-
ing simulation are often presented in terms of soil suction,
water contents, or degree of saturation. This is particularly
true in connection with soil cover design. Often a unique
SWCC relationship is used to move between the stress state
and the amount of water in the soil. The modeler must be
aware of the simplications and assumptions associated with
presenting model simulation results in this manner.
5.2.3 Designation of Stress State
The term “soil suction” has been used to designate matric
suction, osmotic suction, and total suction. Soil suction can
range from zero to 10
6
kPa. The low-suction range needs
transition zone, and
120
100
Note: numbers on curves refer to
preconsolidation pressure
Total suction
All other symbols are matric suction
6.2 kPa
80
25 kPa
50 kPa
60
200 kPa
400 kPa
40
20
0
10
6
1
10
100
1000
10,000
100,000
Soil suction, kPa
Figure 5.11
Soil suction versus gravimetric water content for initially slurry Regina clay (from
Fredlund, 1964).


Search WWH ::

Custom Search