Environmental Engineering Reference
In-Depth Information
in this way depends on the fact that these characteristics may
be interpreted as showing the pore size distribution within
the soil. Thus they play a part analogous and complementary
to mechanics analyses: they give the same sort of informa-
tion about the pores as that given by mechanical analysis
about the particles.”
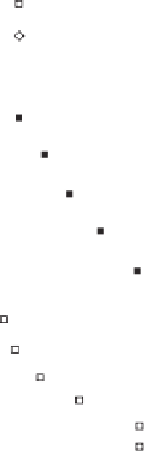
Combining the capillary model and the SWCC led to the
definition of an effective pore-size diameter. The water was
viewed as being held within the smaller diameter pores at
specific soil suction values. The slope of the SWCC repre-
sented the water-filled pores of the soil. An illustration of
pore-size distribution interpreted from the SWCC for a sand
sample and an aggregated clay sample is shown in Fig. 5.3.
The void spaces can be seen to be similar between the sand
and the aggregated clay soil.
Early research in soil physics provided a conceptual model
showing the relationship between the amount of water in
the soil and the energy within the pore-water (Barbour,
1998). The relationship formed a continuous function from
saturated soil conditions to completely dry soil conditions.
Principles of thermodynamic equilibrium between the pore-
water and a reservoir of water at a known energy state were
used to measure the stress state in the water phase. The
energy concept associated with the water phase provided a
useful model for describing unsaturated soil behavior. The
capillary tube model was easy to visualize, but it was a
microtype model that proved to have serious limitations and
apparent anomalies when used to interpret certain unsatu-
rated soil phenomena (Fredlund and Rahardjo, 1993a).
65
Passing
number
6
1
2
48
100
Retained on
number
60
Fine gravel
Coarse sand
Coarse sand
Medium sand
Fine sand
Fine sand
Very Fine sand
8
1
2
48
100
200
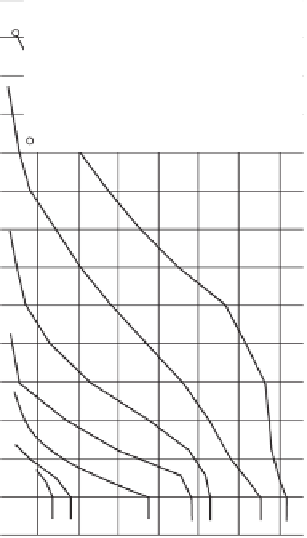
55
50
45
40
Passive capillary height
35
30
25
20
15
10
5
0
Free water surface
-5
0
5
10
5 0 5 0 5
Water content,
w
(%)
Figure 5.2
Distribution of capillary water in sands of varying
gradation (after Valle-Rodas, 1944).
The capillary model visualized water flow as occurring
through a series of capillary tubes. The air-entry value of the
soil corresponded to the difference between the air and water
pressure at which the largest diameter capillary drained.
Childs (1940) and Childs and Collis-George (1948, 1950)
expanded the capillary model to represent a random distri-
bution of pore sizes to represent the SWCC. Childs (1940)
suggested that there was a relationship between the SWCC
and the coefficient of permeability for an unsaturated soil.
The SWCC was assumed to contain valuable information on
the soil structure and the pore size geometry and distribution.
Childs (1940) noted, “Use of the soil moisture characteristics
5.1.5 The SWCC in Early Soil Mechanics
Some of the earliest soil mechanics articles by Karl Terzaghi
and other soil mechanics leaders contained discussions on
unsaturated soil behavior in engineering practice. Terzaghi
(1942) stated, “If the groundwater were subject to no forces
other than gravity there would be a sharp boundary between
dry and saturated soil. This boundary would be located at
the level at which water rises in observation wells. Below
this surface, which is called the watertable or the phreatic
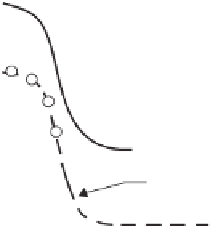
50
40
8
Gault clay
crumb
30
6
30
4
Sand
10
2
0
0.0
0
0.0
1.0
Soil suction,
ψ,
kPa
2.0
3.0
1.0
2.0
Soil suction, kPa
Figure 5.3
SWCCs and pore-size distribution curves for two soils (after Child, 1940).


Search WWH ::

Custom Search