Environmental Engineering Reference
In-Depth Information
Table 4.15 Calculation of Soil Suction on Drying and
Wetting (or Median) SWCC Drying Curve
Table 4.16 Percent Change in Soil Suction for Lateral
Shifts between Drying and Wetting (or Median) SWCCs
Water Dimensionless Suction on Suction on Change in
Content,
Lateral Shift, %
Change (Reduction) in Suction, %
Water
Drying
Wetting
Suction,
%
Content
Curve, kPa Curve, kPa
%
0.0
0.00
10.0
20.57
35.50
0.986
11.4
3.61
68.38
20.0
30.90
33.50
0.931
35.4
11.2
68.38
25.0
43.77
31.50
0.875
55.8
17.7
68.38
30.0
49.88
29.50
0.819
76.6
24.2
68.38
40.0
60.19
27.50
0.764
99.0
31.3
68.38
50.0
68.38
25.50
0.708
124.
39.3
68.38
60.0
74.88
23.50
0.653
154.
48.7
68.38
70.0
80.05
21.50
0.597
190.
60.1
68.38
75.0
82.22
19.50
0.542
236.
74.5
68.38
80.0
84.15
17.50
0.486
296.
93.8
68.38
90.0
87.41
15.50
0.431
383.
120.
68.38
100.0
90.00
13.50
0.375
515.
163.
68.38
120.0
93.69
11.50
0.319
741.
234.
68.38
150.0
96.84
9.50
0.264
1199.
379.
68.38
7.50
0.208
2417.
764.
68.38
5.50
0.153
7834.
2477.
68.38
4.6.2.4 Approximate Shift and Estimation Procedure
When Using the Drying and Wetting SWCCs
It is possible to estimate the maximum suction, the minimum
suction, and the likely median suction for soil suction if the
drying and wetting SWCCs are known. Pham (2002) analyzed
the lateral shift between the drying and wetting SWCCs for
3.50
0.097
95059.
30060.
68.38
2.50
0.069
1476477.
466900.
68.38
Note
: Inflection Point
a
d
=
100 kPa;
n
parameter
=
1
.
5;
m
parameters
1
.
0; 50% lateral shift; and wetting curve
inflection point
a
w
=
=
31
.
623 kPa.
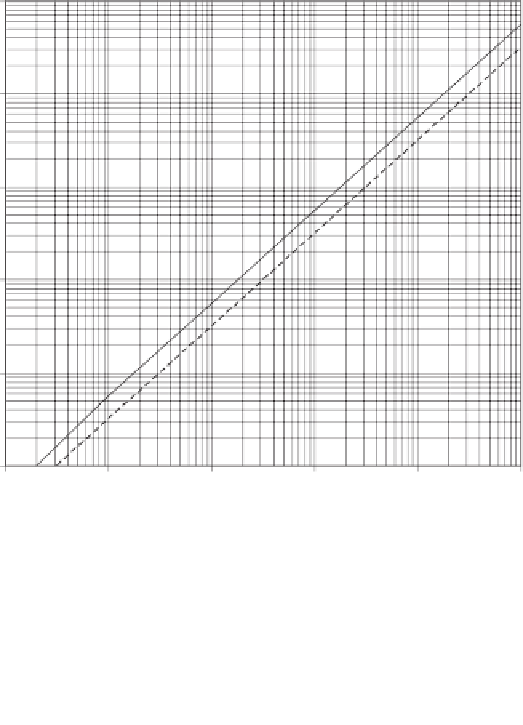
10,000
0 shift
1/4 log cycle shift
1/2 log cycle shift
3/4 log cycle shift
1 log cycle shift
5/4 log cycle shift
1,000
100
10
1
0.1
0.1
1
10
100
1,000
10,000
Suction on drying curve, kPa
Figure 4.103
Relationship between suction on drying curve and suction on any other congruent
SWCC.


Search WWH ::

Custom Search