Environmental Engineering Reference
In-Depth Information
container should be removed to allow water to escape from
the filter paper. After drying, the container and the dry fil-
ter paper are weighed with the lid in place. The difference
between the dry and wet mass of the filter paper is used to
compute the equilibrium water content of the filter paper.
The equilibrium soil suction is obtained from the calibra-
tion curve using the measured equilibrium water content of
the filter paper. The equilibrium suction in the filter paper
is assumed to be equal to the suction in the soil specimen.
It is also possible to measure the calibration curve for
a specific filter paper by measuring the water content of
filter papers that have been equilibrated over salt solutions
having a known osmotic suction. In principle, the filter paper
calibration is similar to the calibration of psychrometers. The
filter paper should be suspended above at least 50 cm
3
of a
salt solution. The procedure for ensuring equilibration and
the measurement of water content is the same as that used
for the measurements of soil suction. Various filter paper
water contents can then be plotted against the respective
osmotic suction value to produce a calibration curve.
The calibration curve for filter papers exhibits a bilinear
shape, as shown in Fig. 4.75. The lower part of the curve
represents the high range of filter paper water contents where
the water is believed to be held by the influence of capillary
forces. On the other hand, the upper part of the calibration
curve represents lower water contents where the water is
believed to be held as an adsorbed water film within the
filter paper (Miller and McQueen, 1978).
The filter paper technique is highly user dependent, and
great care must be taken when measuring the water content
of the filter paper. Each dry filter paper has a mass of about
0.52 g, and at a water content of 30%, the mass of water in
the filter paper is about 0.16 g.
The above filter paper procedure is primarily based on
ASTM standard E833. Recent research on the filter paper
method (Leong et al., 2002a; Rahardjo and Leong, 2006)
has provided further insight into variations and discrepancies
that have been reported when using the filter paper method.
1,000,000
Hamblin (1981)
Chandler and Gutierrez (1986)
Chandler et al. (1992)
Greacen (1987), ASTM (D5298-94)
100,000
10,000
1,000
100
10
1
0
20
40
60
80
100
120
140
160
Filter paper water content, %
(a)
1,000,000
McQueen abd Miller (1968)
Al-Khafaf and Hanks (1974)
McKeen (1980)
Greacen (1978), ASTM (D5298-94)
100,000
10,000
1,000
100
10
1
0
20
40
60
80
100
120
140
160
Filter paper water content, %
(b)
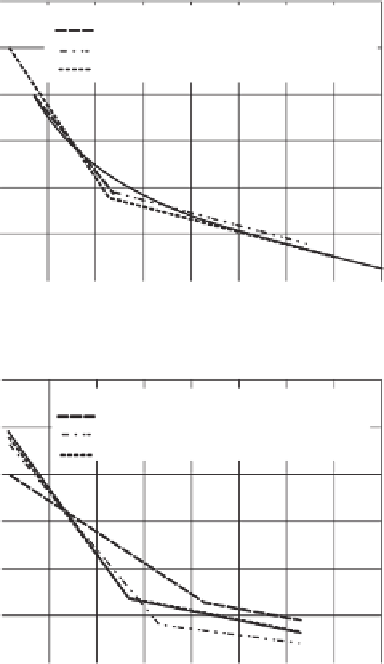
Figure 4.76
Proposed calibration curves for various filter papers
(from Rahardjo and Leong, 2006): (a) calibration of Whatman No.
42 filter paper; (b) calibration of Schleicher and Schuell No. 589
filter paper.
is consistent in terms of its adsorptive characteristics.
Figure 4.76b shows the average calibration curves measured
on Schleicher and Schuell No. 589 in several research
studies. There appears to be slightly more variation in the
calibration curves measured on the Schleicher and Schuell
No. 589 filter paper.
The calibration curves are bilinear in character on a plot
of gravimetric water content versus the logarithm of soil
suction. The transition between the wet and dry portions of
the calibration curve occurs around a water content of about
47% for the Whatman filter paper. The transition between
the wet and dry portions of the calibration curve on the
Schleicher and Schuell No. 589 filter paper appears to range
between water contents of 54 and 85%. The change in slope
on the filter paper calibration curve appears to occur at the
residual suction point on the water retention curve.
Two equations can be written for the bilinear calibra-
tion curve for filter paper. One equation can be written for
the high-water-content range (i.e., low suction range), and
4.3.3.3 Further Details on the Calibration Technique
and Factors Affecting Calibration of Filter Paper
Leong et al. (2002a) and Rahardjo and Leong (2006) under-
took studies on the factors influencing the calibration of filter
paper for the measurement of soil suction. The calibration
curve needs to be accurately measured and needs to be repro-
ducible. Gardner (1937) suggested that improved control in
manufacturing the filter paper might result in greater accu-
racy and repeatability when using the filter paper methodol-
ogy. However, relatively consistent calibration curves have
been observed when using different batches of a particular
brand and filter paper number.
Figure 4.76a shows the average calibration curves
measured on Whatman No. 42 filter paper by a variety
of researchers. All of the calibration curves are similar,
suggesting that
the quality of the Whatman filter paper


Search WWH ::

Custom Search