Environmental Engineering Reference
In-Depth Information
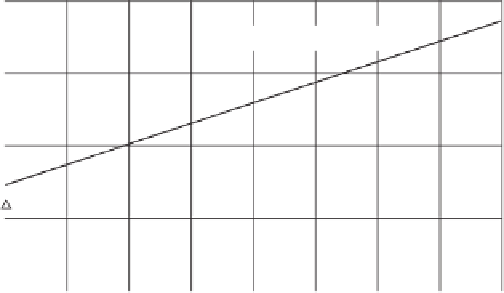
0.70
λ
= 0.0014
t
+ 0.5743
0.65
0.60
0.55
0.50
0
10
20
30
40
50
60
70
80
Temperature,
°
C
Figure 4.50
Thermal conductivity of water versus temperature with linear best-fit equation
(after Shuai et al., 2002).
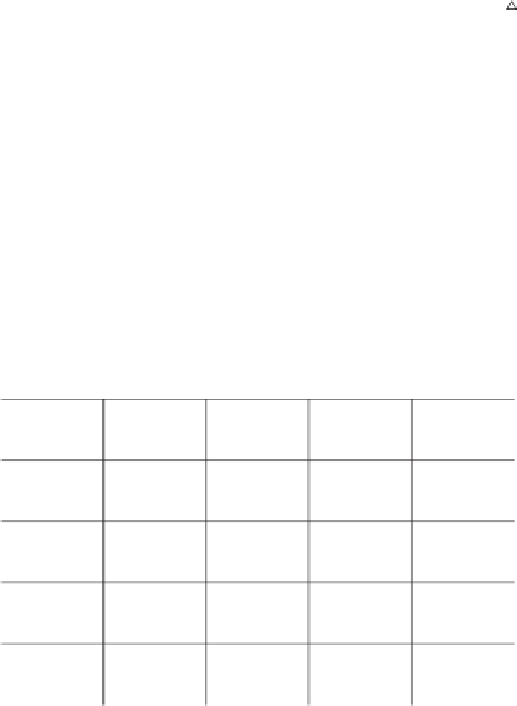
2.0
Ceramic
1.7
1.7
1.6
1.2
0.8
Water
0.561
0.673
0.4
0.0317
0.0241
Air
0.0
0
20
40
60
80
100
Temperature, ˚C
Figure 4.51
Comparison of thermal conductivity of ceramic, air, and water (after Shuai et al.,
2002).
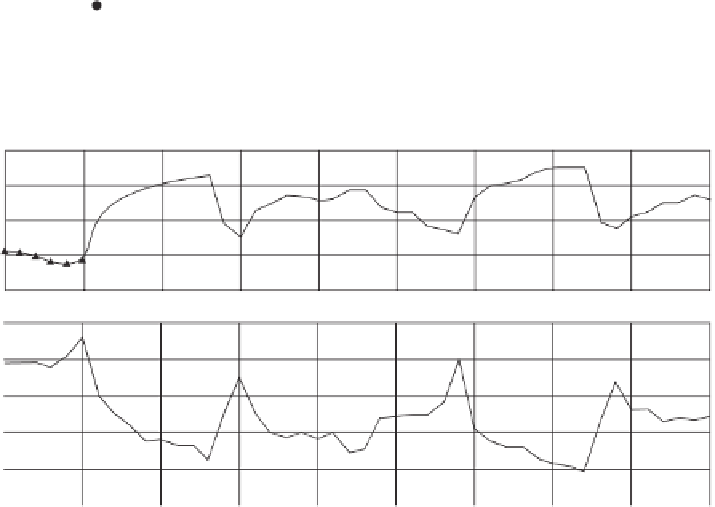
26
25
24
23
22
916
914
912
910
908
906
0
5
10
15
20
25
30
35
40
45
Time, h
Figure 4.52
Observed reaction of thermal conductivity suction sensors to ambient temperature
changes (after Shuai et al., 2002).


Search WWH ::

Custom Search