Environmental Engineering Reference
In-Depth Information
14
13
Sensor
Sensor
1
3
5
7
9
11
13
15
2
4
6
8
10
12
14
16
12
11
10
Trend
9
8
10
6
1
10
100
1000
10,000
100,000
Suction, kPa
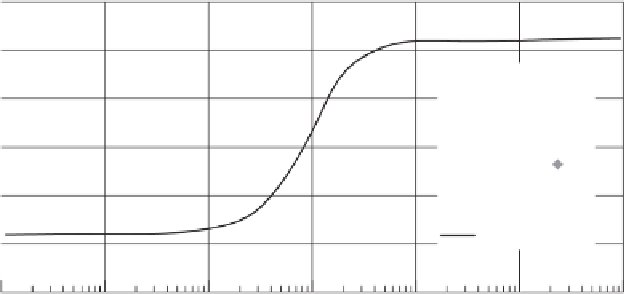
Figure 4.40
Measured temperature changes for 16 FTC-100 thermal conductivity suction sen-
sors (after Hu et al., 2007).
4.2.9.3 Calibration Equations for Thermal Conductivity
Suction Sensors
The electrical response from a thermal conductivity suction
sensor can be plotted versus the logarithm of soil suction.
The resulting curve is S shaped with anchor-type points at
minimum suction (i.e., assumed zero suction) and a maxi-
mum suction (i.e., near 10
6
kPa). The calibration curve has
a sigmoidal shape.
In 1999, Feng and Fredlund proposed the following form
for the calibration equation for thermal conductivity suction
sensors:
The
a
1
and
c
1
fitting parameters in Eq. 4.6 have the same
meaning as the
a
and
c
parameters in Eq. 4.5. The fitting
parameter
b
1
is the suction when
T
is at the inflection
point of the calibration curve. In other words, it is midway
between the “dry” reading and the “saturated” sensor read-
ing. Stated another way,
b
1
is equal to the soil suction at
the inflection point (i.e., suction when
T
=
(a
1
+
c
1
)/
2).
Then,
d
1
is the slope of the calibration curve at point
b
1
(i.e.,
dψ/dT
|
T
=
((a
1
+
c
1
)/
2
)
) (see Fig. 4.41).
The Hu et al. (2007) revision to the calibration equation
was used to analyze the calibration data of 16 FTC-100
thermal conductivity suction sensors. The calibration mea-
surements are summarized in Table 4.5. The Shuai et al.
(2002) temperature correction was applied to the measured
data prior to determining the best-fit equation parameters.
The average values for the four calibration parameters on
the 16 sensors are as follows:
a
1
=
b (T
−
a)
c
−
T
ψ
=
(4.5)
where:
ψ
=
applied suction, kPa,
9
.
19
◦
C,
b
1
=
temperature rise,
◦
C, and
261
.
1 kPa,
T
=
185
.
0 kPa/
◦
C. The
a
1
parameter is
the thermal conductivity sensor reading when the ceramic
is saturated with water, and
c
1
is the thermal conductivity
sensor reading when the ceramic is dry. The
b
1
variable
is the soil suction corresponding to a temperature change
halfway between dry and water saturated conditions (i.e., the
inflection point along the calibration curve on a logarithm
scale). The
d
1
variable is the slope corresponding to point
b
1
.
The following points are noteworthy from the calibration
of the 16 thermal conductivity suction sensors. First, the
a
1
and
c
1
parameters provide the most consistent measurements
on the calibration curve. The standard deviation is similar
for both variables with values of approximately 0.3-0.4
◦
C.
A typical value for the
a
1
parameter was 9.2
◦
C and a typi-
cal value for the
c
1
parameter was 13.2
◦
C. These values are
primarily a function of the constant current applied during
calibration. The
b
1
parameter provides an indication of the
range where the sensor has the greatest sensitivity to suc-
tion changes. The 16 suction sensors calibrated show the
b
1
parameter to be around 260 kPa. The
b
1
and
d
1
parameters
13
.
3
◦
C, and
d
1
=
c
1
=
a
,
b, c, d
=
four parameters to define the shape of the
calibration curve.
Of the four fitting parameters,
a
and
c
are equivalent to
the temperature rise
T
for the thermal conductivity sensors
under saturated and dry conditions, respectively. The parame-
ter
b
defines a particular horizontal position on the calibration
curve and the parameter
d
defines the slope of the curve
at point
b
. However, point
b
was not the most appropriate
point around which to perform the best-fit regression analysis.
Rather, it is better to use the inflection point on the semiloga-
rithm calibration curve for the definition of the
b
parameter.
In 2007, Hu et al. proposed a modification to Eq. 4.5 that
would give more significant physical meaning to each of the
fitting parameters. The new proposed calibration equation
was written as
T
−
a
1
c
1
−
T
d
1
c
1
−
a
1
4
b
1
ψ
=
b
1
(4.6)


Search WWH ::

Custom Search