Environmental Engineering Reference
In-Depth Information
measured thermal conductivity will represent the thermal
conductivity of the ceramic stone with water filling the
voids. This is an easy reading to obtain, but once again,
it is important to define how the ceramic stone has been
saturated with water. It is possible for the “wet or saturated
ceramic stone” to be immersed in water for a period of
time or placed in a back-pressured environment to ensure
that all air has been dissolved in water. Previous research
studies (Feng, 1999; Feng et al., 2002; Feng and Fredlund,
2003) have shown that simply immersing the ceramic
stones in water for a period of time does not fully saturate
the ceramic stone. Rather, occluded air bubbles become
entrapped in some voids of the ceramic stone. It was found
that back-pressuring the ceramics resulted in higher degrees
of saturation and a change in the thermal conductivity
measurement.
The complete calibration of a thermal conductivity suc-
tion sensor generally involves placing the sensors onto a
pressure-plate-type device where three to seven additional
suctions are applied to the sensor while monitoring the out-
put from the sensors. The applied suction values usually
range from 10 to 500 kPa along the desorption calibration
curve. The complete set of data points can then be best fit
using an empirical calibration equation.
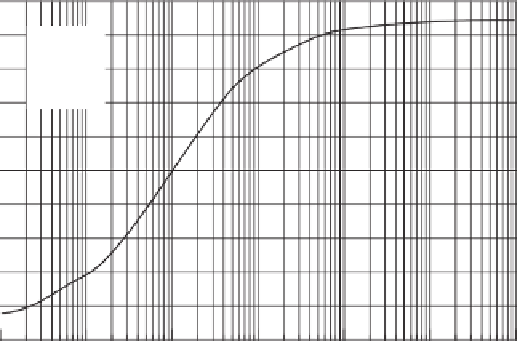
Figure 4.38 shows a typical set of calibration curve data
for the GCTS thermal conductivity (TC) suction sensors.
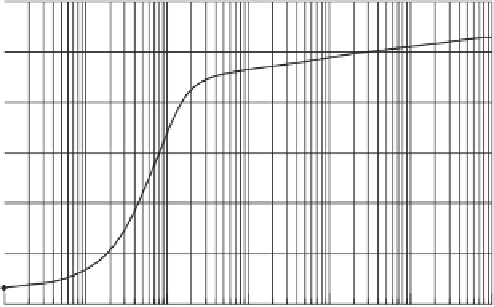
Figure 4.39 shows a typical set of calibration curve data for
the CS-229 TC suction sensors.
Hu et al. (2007) undertook the calibration of 16 GCTS
thermal conductivity suction sensors. The measured tem-
perature changes under the suction applied to each of the 16
TC suction sensors are shown in Fig. 4.40.
500
480
a
= 309.4
b
= 29.02
c
= 488.8
d
= 1.359
460
440
420
400
380
360
340
320
300
10
6
1
10
100
1000
10,000
100,000
Matric suction, kPa
Figure 4.38
Typical calibration curve for FTC-100 thermal conductivity suction sensor (man-
ufactured by GCTS, Tempe, AZ).
3.6
3.1
2.6
2.1
1.6
1.1
0.6
10
6
1
10
100
1000
10,000
100,000
Matric suction, kPa
Figure 4.39
Typical calibration curve for CS-229 thermal conductivity suction sensor (manu-
factured by Campbell Scientific 2006).


Search WWH ::

Custom Search