Environmental Engineering Reference
In-Depth Information
by the temperature sensing element after a specified time
interval, and its magnitude is inversely proportional to the
water content of the porous block. The measured temperature
rise can be expressed in terms of a change in voltage output.
4.2.9.2 Calibration of Thermal Conductivity Suction
Sensors
Thermal conductivity sensors are usually subjected to lim-
ited calibration prior to shipment from the factory. One
calibration reading can be taken with the sensors placed
in water (i.e., zero matric suction). A second calibration
reading can be taken when the sensors are dry. Other cal-
ibration points at specified applied suctions may also be
obtained. This calibration procedure may be adequate for
some applications. However, it is suggested that a more rig-
orous calibration procedure should be used for geotechnical
engineering applications (Fredlund and Wong, 1989).
A more thorough calibration of thermal conductivity sen-
sors can be performed by applying a range of matric suction
values to the sensors. Readings of the change in voltage
output, after the application of a heat impulse, provide a
measure of the thermal conductivity (or the water content)
of the porous block under the applied matric suction. Matric
suctions can be applied to the thermal conductivity sensors
using either a modified pressure plate apparatus (Fig. 4.35;
Wong et al., 1989; Fredlund and Wong, 1989) or a spe-
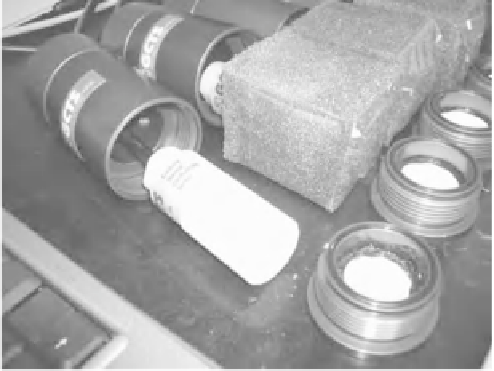
cially designed calibration device (Fig. 4.36; GCTS, 2008).
The maximum suction that can be applied through use of
the axis-translation technique depends on the air-entry value
of the ceramic disk in the calibration device. The air-entry
value of the calibration device is generally 500 kPa.
The use of the small independent calibration chamber
for each thermal conductivity suction sensor appears to be
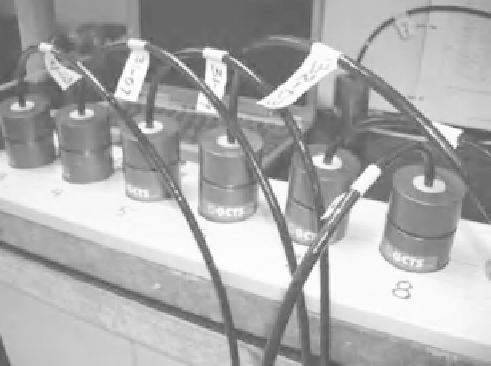
preferable for calibration purposes. Figure 4.37 shows a
series of cells being used for the calibration of the thermal
conductivity suction sensors.
There have been a number of equations that have been
used to best fit calibration data for thermal conductivity
suction sensors.
Figure 4.36
Calibration cells and FTC-100 thermal conductivity
suction sensors (Manufactured by GCTS, Tempe, AZ).
“anchor-type” points on the calibration curve for thermal
conductivity suction sensors. The first calibration anchor
point represents the reading from the sensor when the
ceramic stone is completely dry (or dry to atmospheric
conditions). In other words, the measured thermal conduc-
tivity will represent the thermal conductivity of the ceramic
stone with air filling the voids. It is also important to define
what is meant by a dry ceramic stone. In other words, it
is possible for the “dry ceramic stone” to be initially air
dried, initially oven dried, or initially placed above salts
that create an extremely high total suction environment.
The relative humidity should be recorded that is associated
with the dry condition. This allows the computation of a
total suction value based on Lord Kelvin's equation.
The second calibration anchor point represents the
reading on the thermal conductivity suction sensor when
the ceramic stone is saturated with water. In this case, the
It
is
relatively easy to obtain two
Figure 4.35
Calbration of thermal conductivity suction sensors
in modified pressure plate apparatus.
Figure 4.37
Calibration of series of thermal conductivity suction
sensors (Manufactured by GCTS, Tempe, AZ).


Search WWH ::

Custom Search