Biology Reference
In-Depth Information
3.3.2 Sphericity, motility, zeta-potential, and aggregation
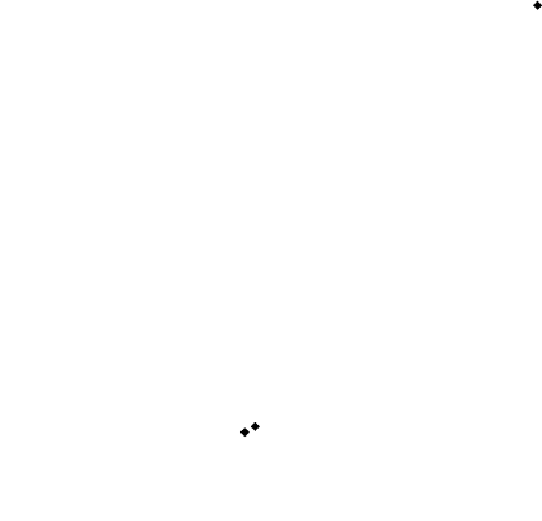
The relation between attachment efficiency and sphericity was very poor (
2
,
;
R
=
0.01
p
=
0.48
2
2
R
=
0.02
,
p
=
0.30
), zeta-potential (
R
=
0.01
,
p
= ). Data on aggregation were not normally distributed, therefore a non-parametric
Spearman correlation was performed, which revealed that the correlation between cell-
aggregration and attachment efficiency was not significant (
0.53
p
= ). From this
we concluded that these four parameters were not able to contribute in explaining inter-strain
attachment efficiencies.
R
2
=
0.004
,
0.67
2.5
2.5
2.0
2.0
1.5
1.5
1.0
1.0
0.5
0.5
0.0
0.0
0
2
4
6
8
10
0.3
0.4
0.5
0.6
0.7
0.8
Motility (cm)
Sphericity (-)
2.5
2.5
2.0
2.0
1.5
1.5
1.0
1.0
0.5
0.5
0.0
0.0
0
20
40
60
15
20
25
30
35
Aggregation (% )
Zeta potential (-mV)
Fig.
3.2:
Relation between attachment efficiency and the parameters cell sphericity,
motility, zeta potential, and aggregation
3.3.3 Serotypes and lipopolysaccharide structure
We grouped the various saccharides into 1. saccharides containing a carboxyl group or a
phosphatyl group, 2. 'plain' saccharides, and 3. saccharides containing an amine group. The idea
behind this grouping was that group 1 saccharides contain an acetate group or phosphate group,
are acidic, and likely charged with a negative O-atom (Orskov et al., 1977; Stenutz et al., 2006),


Search WWH ::

Custom Search