Game Development Reference
In-Depth Information
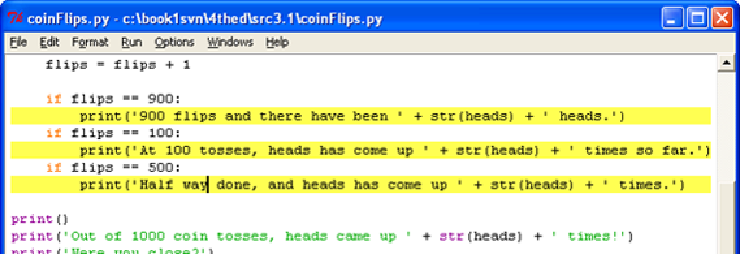
Figure 7-6: Three break points set.
After setting the breakpoints, click Go in the Debug Control window. The program will
run at its normal speed until it reaches flip 100. On that flip, the condition for the
if
statement on line 13 is
True
. This causes line 14 (where we have a break point set) to
execute, which tells the debugger to stop the program and take over. Look at the Debug
Control window in the Globals section to see what the value of
flips
and
heads
are.
Click Go again and the program will continue until it reaches the next break point on line
16. Again, see how the values in
flips
and
heads
have changed. You can click Go one
more time to continue the execution until it reaches the next break point.
And if you click Go again, the execution will continue until the next break point is
reached, which is on line 12. You probably noticed that the
print()
functions on lines
12, 14 and 16 are called in a different order than they appear in the source code. That is
because they are called in the order that their
if
statement's condition becomes
True
.
Using the debugger can help make it clear why this is.
Summary
Writing programs is only part of the work for making games. The next part is making
sure the code we wrote actually works. Debuggers let us step through the code one line at a
time, while examining which lines execute (and in what order) and what values the
variables contain. When this is too slow, we can set break points and click Go to let the
program run normally until it reaches a break point.
Using the debugger is a great way to understand what exactly a program is doing. While
this topic provides explanations of all the games in it, the debugger can help you find out
more on your own.