Agriculture Reference
In-Depth Information
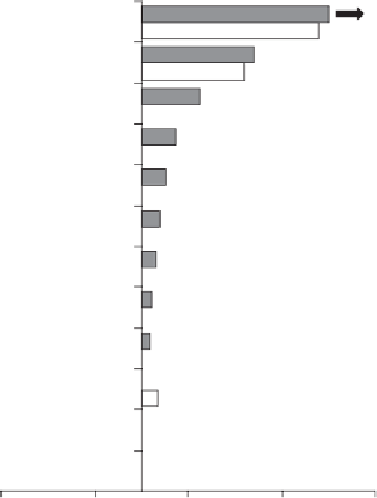
(a) Developing countries
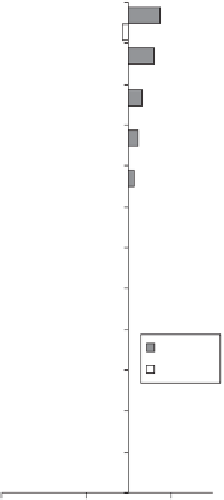
(b) High-income countries
387
Sugar
Rice
Milk
Sugar
Rice
Milk
Poultry
Beef
Wheat
Poultry
Maize
Cotton
Pigmeat
Pigmeat
Coee
Soybean
2000-04
1980-84
2000-04
1980-84
Soybean
Maize
Beef
Wheat
Barley
Coconut
Rapeseed
Cotton
-150
-50
50
-150
-50
50
150
250
Figure 14.5
NRAs by product, developing and high-income countries, 1980-84 and 2000-
04 (percent)
Source: Anderson (2010, Figure 2.6), based on estimates in Anderson and Valenzuela (2008).
because the rise and then decline in agricultural export subsidies has been matched by a
similar trajectory for import protection.
The fall in assistance to producers of nonfarm tradable goods has contributed to
just over half the rise in the RRA for developing countries between 1960-1984 and
2000-2004.
Up to the 1980s, and in some cases into the early 1990s, it was not uncommon for
government interventions in the market for foreign exchange in developing countries to
add to the overall anti-trade bias in policy regimes. Those interventions had all but dis-
appeared by the mid-1990s, however, as part of overall macroeconomic policy reform
initiatives.
The phasing out of export taxes by most developing countries, shown in Figure 14.6(a),
is particularly striking. There have been some reversals of that policy reform in a few devel-
oping countries, though, with Argentina being the most important example. Meanwhile,
with the growth in assistance to the agricultural import-competing subsector of develop-
ing countries (upper line in Figure 14.6(a)), the relative importance of import taxes has
increased substantially (Figure 14.7).


Search WWH ::

Custom Search