Agriculture Reference
In-Depth Information
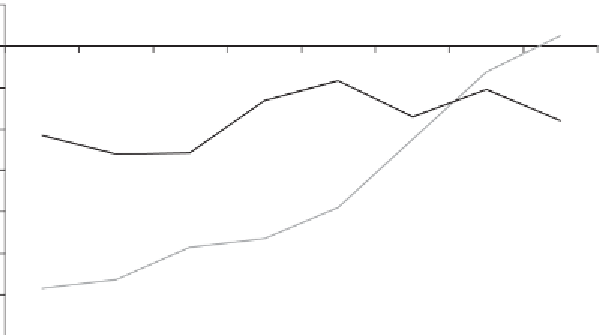
(a) Developing countries
10
0
1965-69
1970-74
1975-79
1980-84
1985-89
1990-94
1995-99
2000-04
-10
-20
-30
-40
-50
-60
Asia
Africa
LAC
-70
(b) High-income countries
200
Japan/Korea
Non-EU WE
EU
Canada
US
Australia / New Zealand
150
100
50
0
-50
Figure 14.3
Relative rates of assistance to agriculture, by region, 1955 to 2007
Source: Anderson (2009, Ch. 1), based on estimates in Anderson and Valenzuela (2008).
and high in almost all countries (sugar, rice, milk), others are positive and high in devel-
oped economies but highly negative in developing countries (most noticeably, cotton),
and yet others are relatively low in all countries (feedgrains, soybean, pork, poultry).
An important aspect of this dispersion of NRAs is that the agricultural policy regime of
each country still tends to have an anti-trade bias. This bias has declined over time for
the developing country group, mainly because of cuts in agricultural export taxation
and in spite of growth in agricultural import protection. For the high-income group, the
anti-agricultural trade bias has shown a lesser decline over time (Figure 14.6), mainly


Search WWH ::

Custom Search