Agriculture Reference
In-Depth Information
Fat engel curves
Rural
4.5
1993
2004
4
3.5
3
2.5
5.5
6
6.5
7
7.5
Log of monthly per capita expenditure
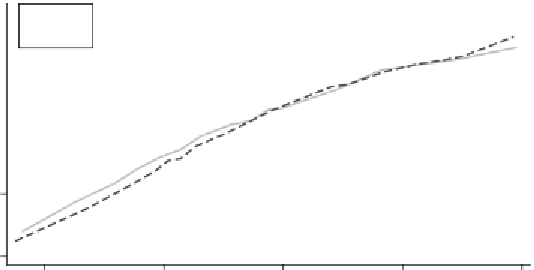
Figure A5
Fats Engel Curves, Rural India, 1993-2004
Fat engel curves
Urban
4.5
1993
2004
4
3.5
3
2.5
5.5
6
6.5
7
7.5
Log of monthly per capita expenditure
Figure A6
Fats Engel Curves, Urban India, 1993-2004
Fats
In rural areas, the fats Engel curves for 1993 lies below that for 2004 at lower levels of
MPCE (Figure A5). The crossover is at approximately Rs650. In urban areas, the cross-
over is at Rs1000 (Figure A6). The curves converge beyond this.
Notes
1. Much of the research summarized here was conducted by the first author during his stay
at the Department of Urban Studies, MIT, and subsequently at Harvard School of Public
Health, in close collaboration with the co-authors. He would like to thank Bish Sanyal,


Search WWH ::

Custom Search