Agriculture Reference
In-Depth Information
14
12
10
8
6
4
2
0
PDS
Total
0-10
10-20
20-30
30-40
40-50
50-60 0-70
70-80 0-90
90-100
Expenditure decile
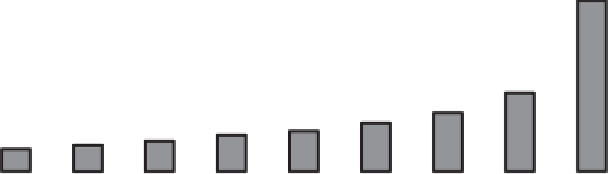
Figure 12.3
Per capita grain consumption, PDS and total, 2004-05
Source: Roy Chaudhuri and Somanathan (2011)
population. In this figure, 0-10 is the bottom-most decile of the population when ranked
by expenditure. The average consumption of rice and wheat for every person in this decile
is a about 10 kg per month, of which the PDS supplied a little less than 2 kg. Similar inter-
pretation attaches to the other bars. It is clear that the second condition is violated.9
Even if the subsidy transfer were to increase 5 kg per person (as proposed in the food
security act), it would still fall short of what households purchase anyway. So even
though it is an in-kind transfer, households save the money that would have been used
to buy food to purchase other commodities. The point is not that in-kind transfers will
not increase food intake but that the impact may well be no different from that of a cash
transfer.
In fact, it is likely that whatever the form of subsidy, the effect on grain purchases
will be small. Figure 12.4 shows the average total consumption expenditure per person
within each of these deciles. From both these figures, it is clear that despite wide differ-
ences in total consumption expenditure the amounts of wheat and rice purchases do not
differ that much between the rich and the poor. As the poor become better off, the major
3000
2500
2000
1500
1000
500
0
0-10
10-20
20-30
30-40
40-50
50-60
60-70
70-80
80-90
Expenditure Decile
Figure 12.4
Per capita consumption expenditure by expenditure decile, 2004-05
Source: Roy Chaudhuri and Somanathan (2011)


Search WWH ::

Custom Search