Biomedical Engineering Reference
In-Depth Information
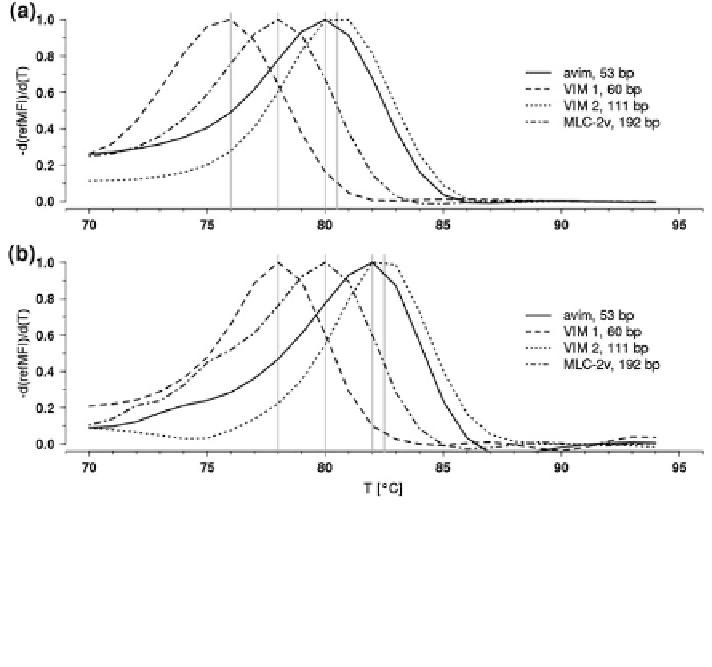
Fig. 19 Comparison of the melting peaks of the a i Q5 thermal cycler (top) and the b VideoScan
HCU (bottom). Negative first derivatives of the refMFI were plotted versus the temperature. For
better comparison, data were normalized to the maximum fluorescence intensity. Both systems
report identical melting peak shapes but with an offset of about 2 C. Note: MLC-2v reported a
different T
M
compared to the qPCR experiments. This was due to different buffers and the fact
that the synthetic sequences contained no dUTP in contrast to PCR products amplified with the
Maxima PCR kit (Fermentas)
In conclusion, the VideoScan HCU allows real-time PCR experiments including
melting curve analysis, broadening the spectrum of applications significantly.
6.3 Multiplex Melting Curve Analysis on the Surface
of Microbeads
A desirable advance of the VideoScan platform is a real-time PCR microbead
assay that would require a melting curve analysis on the microbead surface. Being
able to perform multiplex melting curve analysis would also help to understand
fundamental hybridization processes which are influenced by the interaction
between capture probes and analytes under different reaction environments,
incubation times and temperature schemes [
78
,
79
]. Generally, multiplex melting
curve analysis requires easily distinguishable FRET pairs or probe immobilization
on defined positions [
13
]. To perform multiplex melting curve analysis on the