Agriculture Reference
In-Depth Information
separate rainfall-runoff coefficients. Due to the irrigation activities that take
place in the dry season in the Vea scheme the soil-moisture conditions and
land cover of the scheme differs from the areas outside the scheme which
explains the different rainfall-runoff coefficients. The rainfall-runoff
coefficients for Anayari are assumed to be the same as that of Atankwidi as
they have similar characteristics. The annual average of the rainfall-runoff
coefficient for the three catchments is almost equal to the long-term average
(0.13) estimated by Martin (2006). This makes the runoff-coefficients
suitable for the analysis of scenarios which depend on long-term
characteristics of the study area. The results are further considered reliable,
considering the fact that, the 2005/2006 was a normal rainfall year (this is
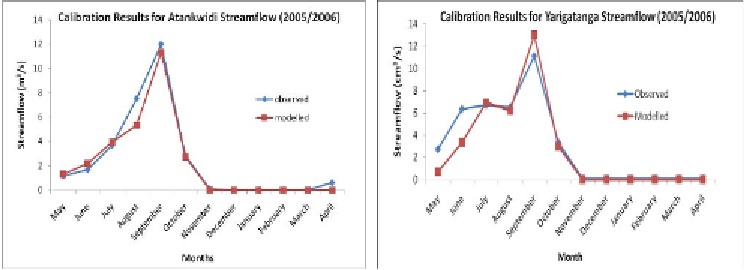
shown in next section). Results of the calibration are shown in Figure 8.2.
Figure 8.2:
Calibrated streamflow; a) Atankwidi; b) Yarigatanga
For the Atankwidi catchment, the modelled streamflow values are close to
the observed streamflow (Figure 8.2). The modelled streamflow for the
Yarigatanga catchment differed significantly from the observed streamflow
values for the months of May, June and September. This may be due to
reasons other than rainfall-runoff generation.
8.3.5 Validation
The calibrated model results were then validated on streamflow records of
2004/2005 (Figure 8.3). In the Yarigatanga catchment, the modelled
streamflow is higher in the months of July, August and September than the
observed. The significant difference in the streamflow values for the
Yarigatanga catchment can be attributed to the presence of the reservoir.
The Yarigatanga catchment has much more reservoir storage (20x10
6
m
3
)
than Atankwidi (0.2x10
6
m
3
). The reservoir buffers the runoff for the
Yarigatanga catchment, but this could not be modelled due to lack of data.
Search WWH ::

Custom Search