Agriculture Reference
In-Depth Information
East Region to determine the relationship between average volume and
average depth (van de Giesen et al., 2008).
V = 0.00857 x A
1.4367
Equation 8.1
V
half pyramid
= 1/6*A*d
Equation 8.2
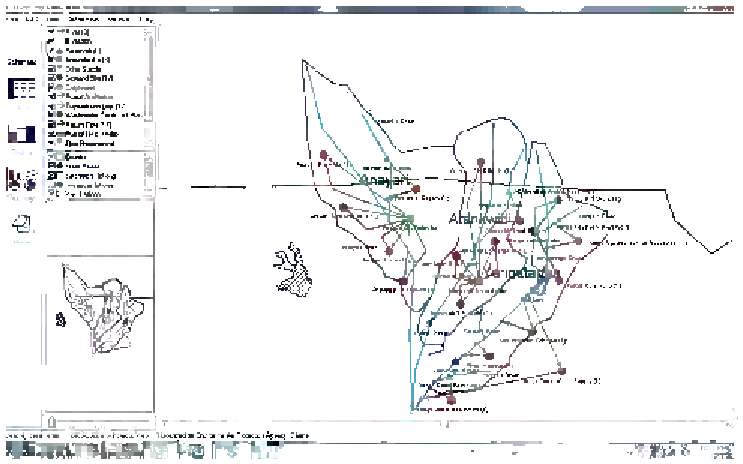
Figure 8.1
: Schematic layout of catchment and modelled parameters in WEAP.
The various demand nodes are placed in the catchments and connected to
their water supply sources. Each demand is assigned an allocation priority,
water consumption, percentage consumption and annual demand pattern.
Unused water by the demand nodes is returned to water sources which
receive the return flows as observed in the field. For example, return flows
from groundwater irrigation technologies are returned back to the
groundwater source
(Figure 8.1)
.
The streamflow values for the various streams are estimated from the
rainfall-runoff coefficients, monthly rainfall values and catchment areas of the
streams. The streamflow values are entered as headflows for the streams.
Other parameters such as reservoirs and stream gauges are also positioned
on the streams.
Search WWH ::

Custom Search