Agriculture Reference
In-Depth Information
120
100
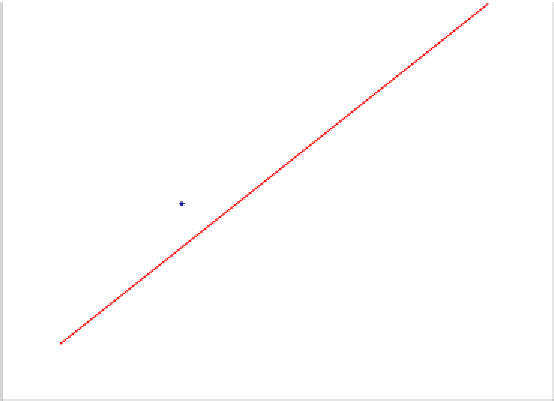
y = 0.89x
R
2
= 0.72
80
60
40
20
0
0
20
40
60
80
100
120
observed crop yield (kg/m
2
)
Figure 6.3: Performance of a regression analysis of crop yield of irrigation
technologies.
Further statistical analysis on the results showed that the estimates of the
parameters are significant at 5% level.
Figure 6.3
shows the relationship
between observed and simulated crop yields of all 90 farmers included in the
analysis.
Equation 6.2 shows that the amount of fertilizer applied to the crop has a
significant impact on crop yield: 1 kg/m
2
of chemical fertilizer applied results
in a yield increase of 200 kg/m
2
tomatoes per season. This figure is higher
compared to the O/N (output/nutrient) ratio in West Africa for other crops
such as maize (range of 0-54) and groundnuts (range of 4-21) (Yanggen et
al., 1998), implying a high yield response to fertilizer for tomatoes in the
study area. The Value/Cost Ratio (VCR), which is a rudimentary indicator
of potential profitability, is also measured based on the yield response to
fertilizer, the cost of fertilizer (see Section
6.3.2)
and the sales value of
tomatoes (see Figure 6.4b). The VCR for applying fertilizer to the tomato
crop ranges from 5-120 in the study area. According to Kelly (2005) the rule-
of-thumb for VRCs is that they must be at least two before a farmer will
consider fertilizer use, while in high-risk production environments the
minimum VCR for adoption may be 3 or 4. This implies that fertilizer use in
tomato production has a high profitability in the study area.
Equation 6.2 indicates that irrigation technologies that rely on groundwater
achieve significantly higher crop yields than those relying on surface water.
We have no satisfactory explanation of this finding, but it may be associated
with factors that are associated with irrigation technologies that abstract
groundwater rather than the groundwater itself. Equation 6.2 also indicates


Search WWH ::

Custom Search