Graphics Programs Reference
In-Depth Information
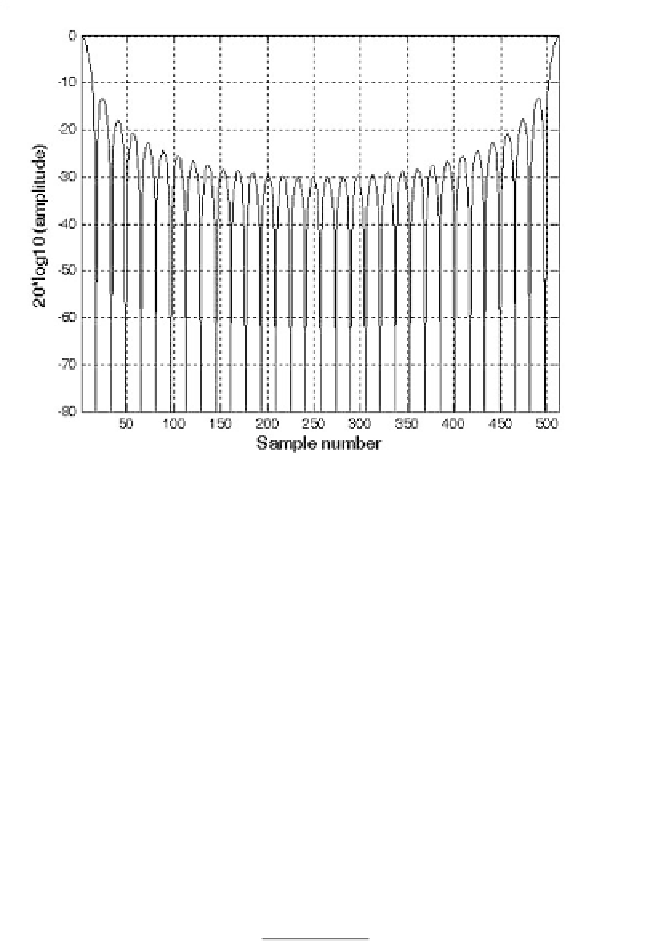
Figure 13.2. Normalized amplitude spectrum for rectangular window.
where is defined in Eq. (13.132). Table 13.2 lists some common windows.
Figs. 13.3
through 13.5 show the frequency domain characteristics for these
windows. These figures can be reproduced using MATLAB program
Ðfigs13.mÑ
.
P
w
TABLE 13.2.
Some common windows.
n
=
0
N
,
1.
First side
lobe
Main lobe
width
Window
Expression
rectangular
w
() 1
=
13.46
dB
1
Hamming
41
dB
2
2π
n
N
-------------
w
() 0.54
=
0.46
cos
1
Hanning
32
dB
2
2π
n
N
-------------
w
() 0.5 1
=
cos
1
Kaiser
46
dB
for
5
for
β
)
2
w
()
I
0
β 1
nN
[
(
⁄
]
=
-----------------------------------------------
I
0
()
β
=
2π
=
2π
is the zero-order modified Bessel
function of the first kind
I
0


Search WWH ::

Custom Search