Graphics Programs Reference
In-Depth Information
Symbol
Description
Units
Status
nf
noise figure
dB
input
loss
radar losses
dB
input
range
target range (can be either a sin-
gle value or a vector)
meters
input
np
number of integrated pulses
none
input
ci_nci
1 for CI; 2 for NCI
none
input
snr
SNR (single value or a vector,
depending on the input range)
dB
output
U
s
ing
para
m
et
e
r
s
o
f
pr
e
v
i
o
us exam
p
le,
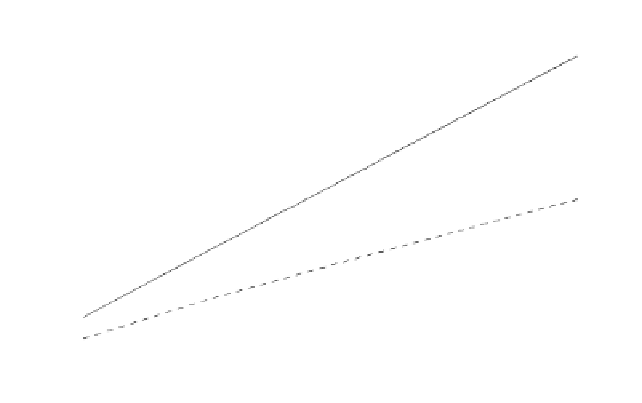
R=5
.
01
Km
40
35
30
25
20
15
10
5
0
Coherent integration
Non-coherent integration
-5
-10
10
0
10
1
10
2
10
3
10
4
Number of integrated pulses
Figure 1.21. SNR improvement when integration is utilized.
1.8. Radar Losses
As indicated by the radar equation, the receiver SNR is inversely propor-
tional to the radar losses. Hence, any increase in radar losses causes a drop in
the SNR, thus decreasing the probability of detection, as it is a function of the
SNR. Often, the principal difference between a good radar design and a poor
radar design is the radar losses. Radar losses include ohmic (resistance) losses
and statistical losses. In this section we will briefly summarize radar losses.


Search WWH ::

Custom Search