Graphics Programs Reference
In-Depth Information
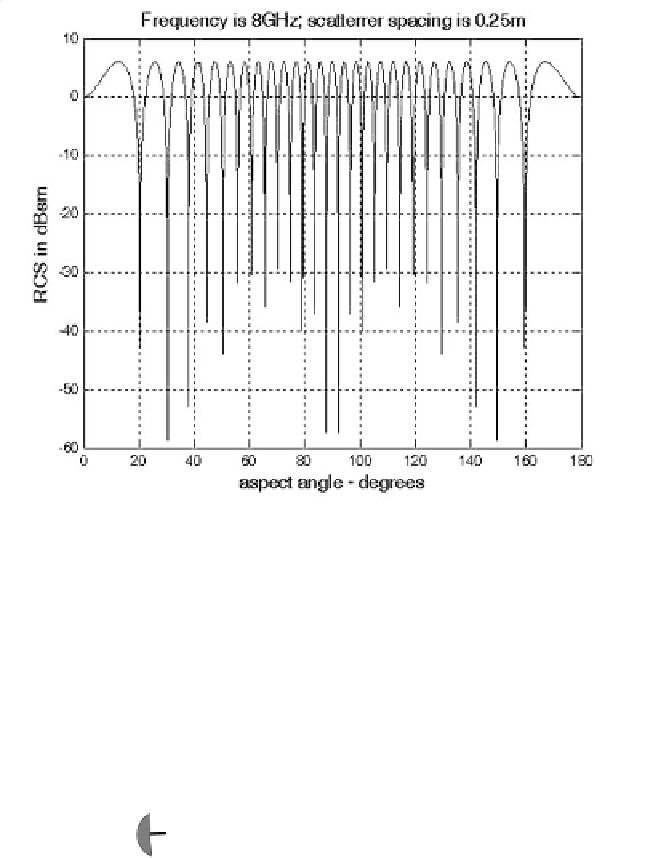
Figure 11.3. Illustration of RCS dependency on aspect angle.
Next, to demonstrate RCS dependency on frequency, consider the experi-
ment shown in Fig. 11.4. In this case, two far field unity isotropic scatterers are
aligned with radar line of sight, and the composite RCS is measured by the
radar as the frequency is varied from 8 GHz to 12.5 GHz (X-band).
Figs. 11.5
and 11.6 show the composite RCS versus frequency for scatterer spacing of
0.25 and 0.75 meters.
scat1
scat2
r
ad
a
r l
in
e
of
s
i
ght
radar
dist
Figure 11.4. Experiment setup which demonstrates RCS
dependency on frequency; dist = 0.1, or 0.7 m.


Search WWH ::

Custom Search