Graphics Programs Reference
In-Depth Information
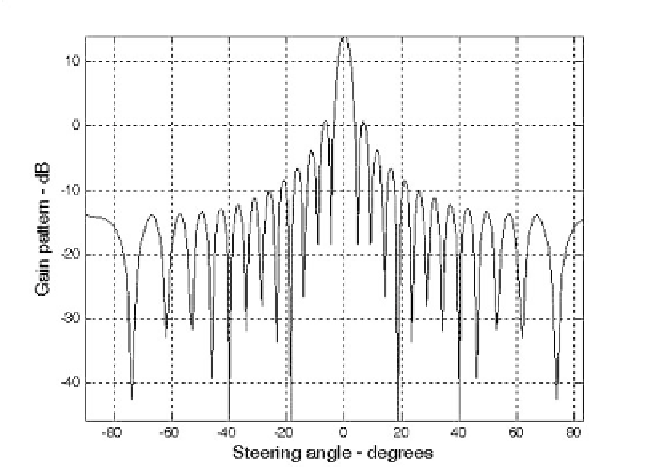
Figs. 8.10 through 8. 18 respectively show plots of the array gain pattern ver-
sus steering angle for the following cases:
[theta, patternr, patterng] = linear_array(25, 0.5, 0, -1, -1, -3);
[theta, patternr, patterng] = linear_array(25, 0.5, 0, 1, ÒHammingÓ, -3);
[theta, patternr, patterng] = linear_array(25, 0.5, 5, -1, -1, 3);
[theta, patternr, patterng] = linear_array(25, 0.5, 5, 1, ÒHammingÓ, 3);
[theta, patternr, patterng] = linear_array(25, 0.5, 25, 1, ÒHammingÓ, 3);
[theta, patternr, patterng] = linear_array(25, 1.5, 40, -1, -1, -3);
[theta, patternr, patterng] = linear_array(25, 1.5, 40, 1, ÒHammingÓ, -3);
[theta, patternr, patterng] = linear_array(25, 1.5, -40, -1, -1, 3);
[theta, patternr, patterng] = linear_array(25, 1.5, -40, 1, ÒHammingÓ, 3);
Users are advised to utilize the GUI developed for this function and test a
few cases of their own.
Figure 8.10. Array gain pattern:
Nr
=
25
;
dolr
=
0.5 θ
0
;
=
0°
;
win
=
none
;
nbits
=
3
.
Search WWH ::

Custom Search