Graphics Programs Reference
In-Depth Information
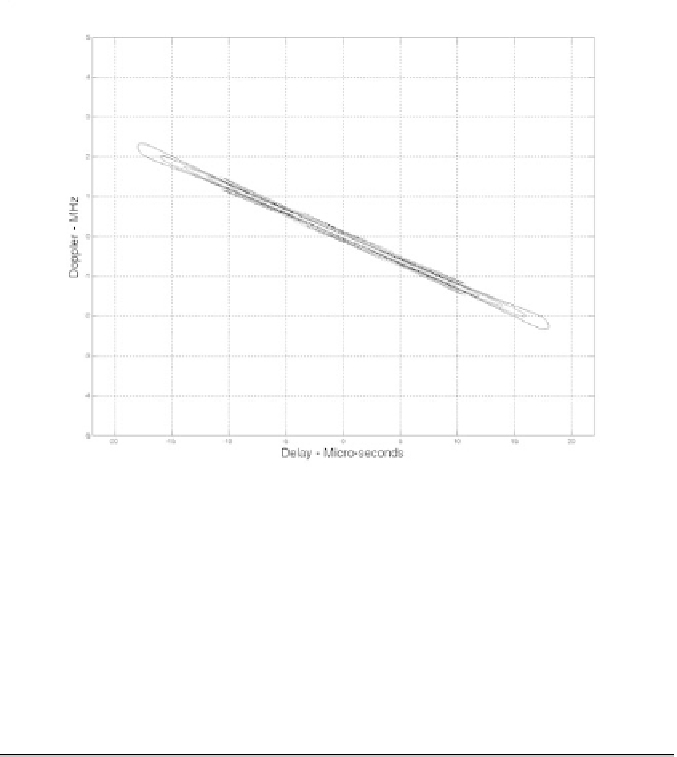
Figure 4.26. Contour of the ambiguity plot for
ÐMyRadarÑ
search
waveform.
4.6. MATLAB Program and Function Listings
This section presents listings for all MATLAB programs/functions used in
this chapter. The user is strongly advised to rerun the MATLAB programs in
order to enhance his understanding of this chapterÓs material.
Listing 4.1. MATLAB Function Ðsingle_pulse_ambg.mÑ
function x = single_pulse_ambg (taup)
colormap (gray(1))
eps = 0.000001;
i = 0;
taumax = 1.1 * taup;
taumin = -taumax;
for tau = taumin:.05:taumax
i = i + 1;
j = 0;
for fd = -5/taup:.05:5/taup %-2.5:.05:2.5
j = j + 1;

Search WWH ::

Custom Search