Graphics Programs Reference
In-Depth Information
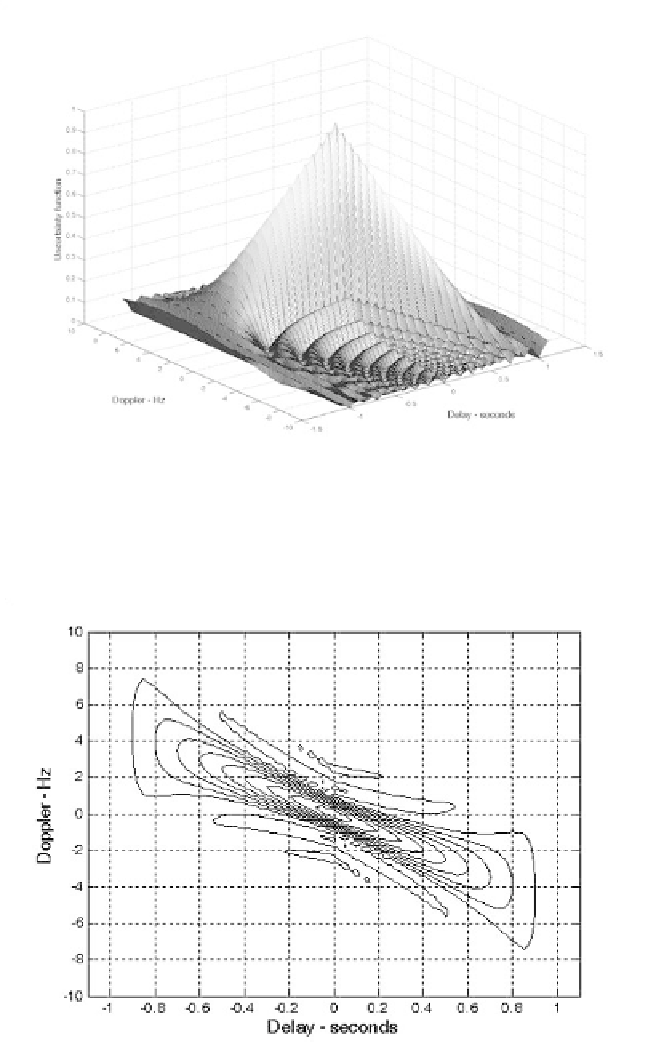
Figure 4.5a. Up-chirp LFM 3-D uncertainty plot. Pulsewidth is 1 second; and
bandwidth is 10 Hz.
Figure 4.5b. Contour plot corresponding to Fig. 4.5a.
Search WWH ::

Custom Search