Graphics Programs Reference
In-Depth Information
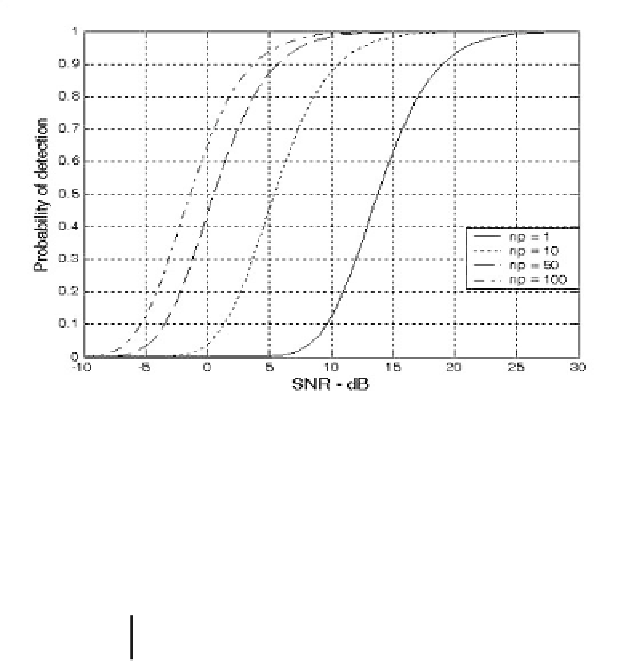
Fig. 2.13 shows a plot of the probability of detection as a function of SNR
for , where . This figure can be reproduced
using MATLAB program
Ðfig2_13.mÑ
given in Listing 2.22.
9
n
P
=
11050100
,
,
,
P
fa
=
10
9
P
fa
=
10
Figure 2.13. Probability of detection versus SNR. Swerling III.
.
2.6.5. Detection of Swerling IV Targets
The expression for the probability of detection for Swerling IV targets for
is
n
P
<
50
2
n
P
(
n
P
1
)
SNR
2
SNR
2
n
P
γ
1
-----------
-----------
-------------------------
γ
2
P
D
=
1
γ
0
+
+
+
…
+
(2.83)
2!
n
P
γ
n
P
n
P
SNR
2
SNR
2
-----------
1
+
-----------
where
V
T
γ
i
=
Γ
I
--------------------------------
,
n
P
+
i
(2.84)
1
+
(
SNR
)
⁄
2
By using the recursive formula
x
i
Γ
I
(
xi
1
,
+
)
=
Γ
I
(
xi
,
)
---------------------
(2.85)
i
!
exp
()
then only
γ
0
needs to be calculated using Eq. (2.84) and the rest of
γ
i
are cal-
culated from the following recursion:


Search WWH ::

Custom Search