Geology Reference
In-Depth Information
(a)
(b)
60
1.0
75%
50%
25%
75%
50%
25%
5/30/82
5/30/82
50
0.8
avg-par
avg-par
40
obs.
obs.
0.6
30
0.4
20
0.2
10
0
0
30
70
110
150
190
30
70
110
150
190
Time (min)
Time (min)
(c)
(d)
1000
75%
50%
25%
6/13/83
75%
50%
25%
6/13/83
0.6
800
avg-par
avg-par
obs.
obs.
600
0.4
400
0.2
200
0
0
30
70
90
110
150
190
50
70
90
110
130
150
Time (min)
Time (min)
(e)
(f)
1.2
8/26/81
75%
50%
25%
8/26/81
75%
50%
25%
40
1.0
avg-par
avg-par
0.8
30
obs.
obs.
0.6
20
0.4
10
0.2
0
0
40
60
80
100
120
140
40
60
80
100
120
140
Time (min)
Time (min)
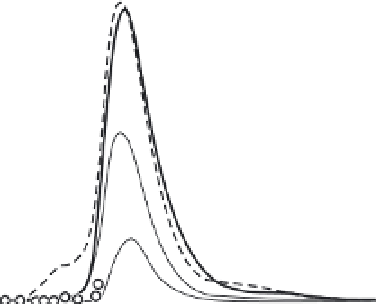
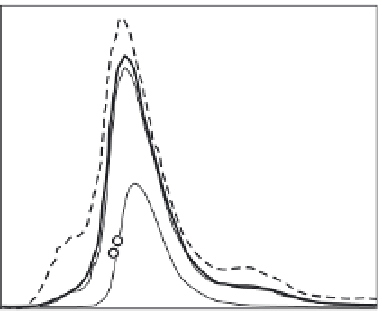
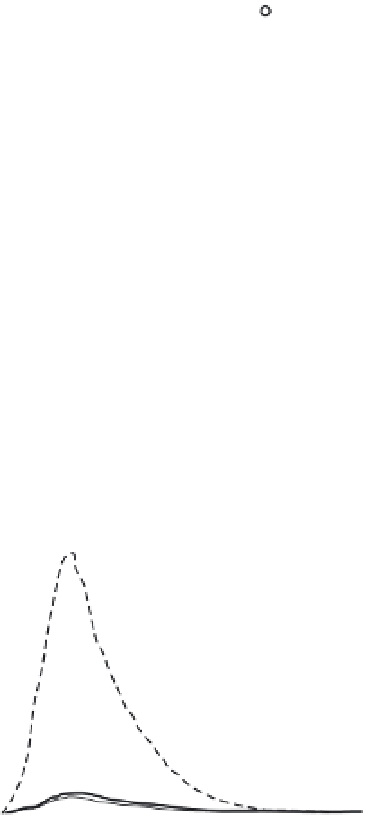
Fig. 4.3
Comparison with observed values of Monte Carlo-generated 75th, 50th and 25th percentiles,
and simulated model flow rates and sediment discharges based on average model parameters (avg-par).
Monte Carlo simulations of the KINEROS2 model (after Hantush & Kalin, 2005).