Geology Reference
In-Depth Information
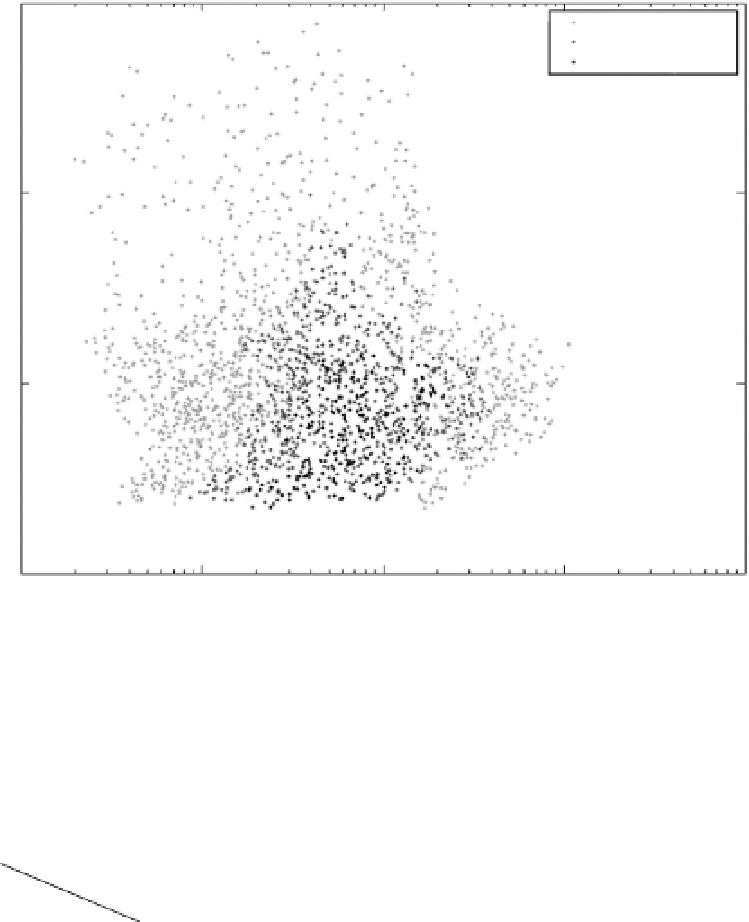
1.5
0.40 < wK < 0.45
0.45 < wK < 0.45
wK > 0.50
1
0.5
0
10
-3
10
-2
10
-1
Reinfiltration length L
(
m
)
10
0
10
1
Fig. 3.3
ratio versus reinfiltration length
L
(in logarithmic scale) at different
intervals of weighted Kappa (wK), from Vigiak
et al
. (2006).
Scatterplot of power
α
/
γ
Table 3.2
Contingency table of the ACED map (observed) and the average output
of model behavioural simulations (predicted), from Vigiak
et al
. (2006). The
diagonal represents the number of correctly classified units in each class
(irrespective of their size).
Very
slight
Observed
Slight
Moderate
Severe
Very severe
Predicted
Very slight
33
21
8
5
4
Slight
24
19
18
10
11
Moderate
16
21
30
16
8
Severe
4
9
16
14
26
Very severe
2
9
9
22
35
question of how to obtain detachment and
deposition patterns to improve model calibra-
tion. There are several possibilities (not in any
particular order of importance):
(i)
Soil surface crusting indices
. In areas where
the soil is prone to crusting, good results have
been obtained by coupling the effects of tillage
and subsequent crusting by rainfall to analyse
source areas of runoff. The model STREAM is a
decision support based system linked to a classi-
fication of the degree of crusting in a catchment,
based on extensive research in northern France