Geology Reference
In-Depth Information
(a)
(b)
(c)
(d)
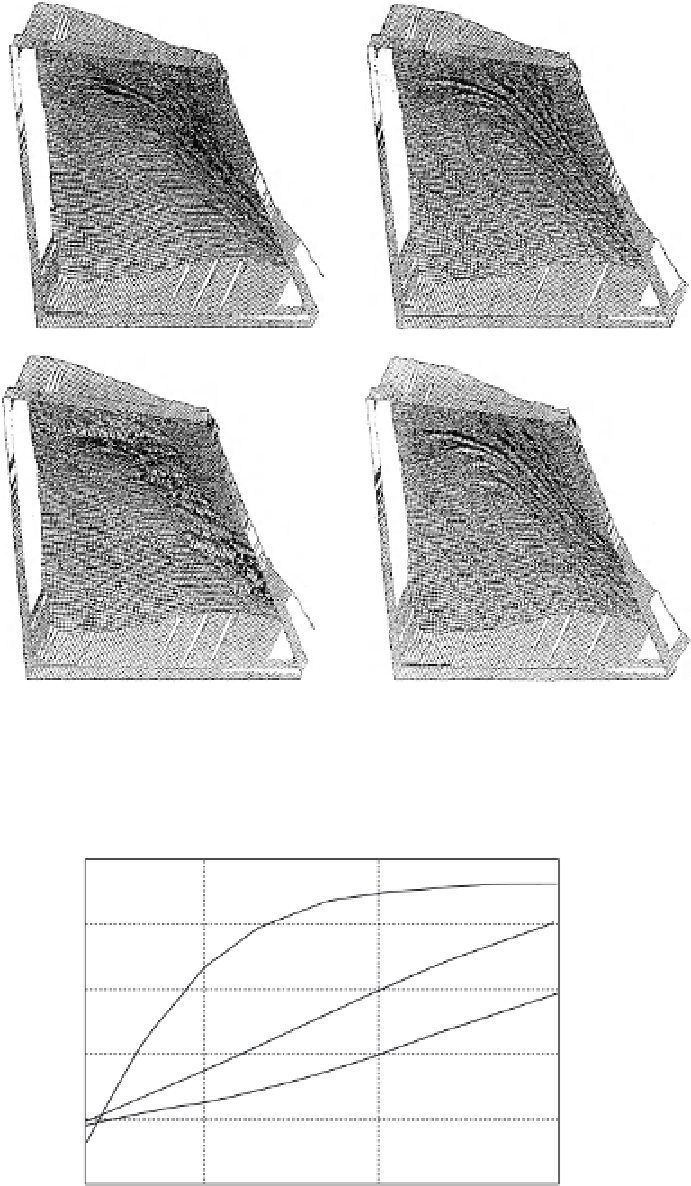
Fig. 18.4
Simulations of 100
years of erosion with and without
contour banks. (a) Original
landform without contour banks;
(b) original landform with
contour banks; (c) 100-year
erosion without contour banks;
(d) 100-year erosion with contour
banks. Grid spacing is 1 m and
the left-to-right dimension of the
domain is approximately 100 m
(from Gyasi-Agyei & Willgoose,
1996).
10
4
100
c
10
3
80
10
2
60
Fig. 18.5
The cumulative net erosion
(i.e. net erosion
10
1
40
erosion − deposition)
over 1000 years for the landform in
Fig. 18.4. Note that these simulations
assume that at no stage do the contour
banks overtop, so that the contour banks
are perfectly efficient throughout the
1000 years (from Gyasi-Agyei &
Willgoose, 1996).
=
10
0
with contour banks
20
without contour banks
% reduction in net erosion
10
-1
0
10
1
10
2
10
3
Number of years of simulation