Geology Reference
In-Depth Information
(a)
(b)
4.364
4.364
-6
(c)
12.96
12.96
0.0
0.0
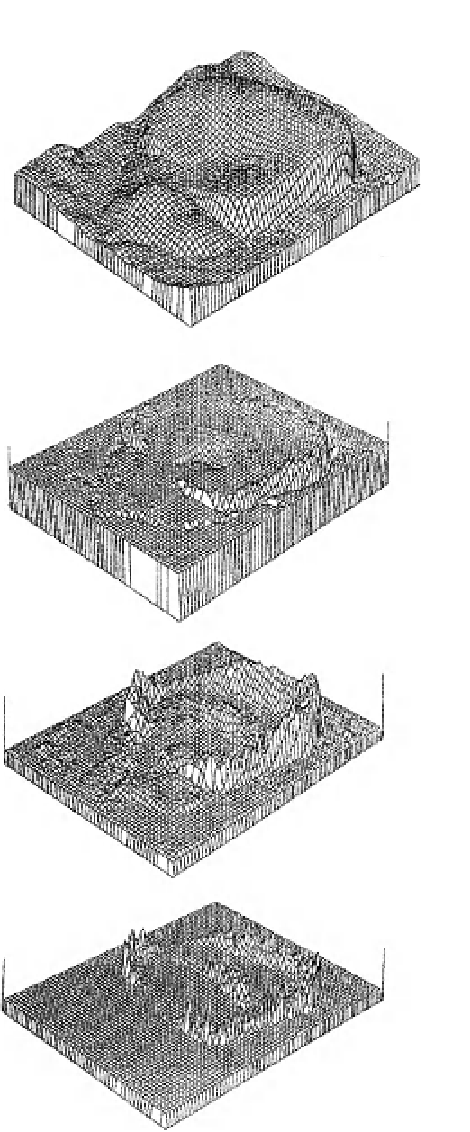
Fig. 18.3
Erosion risk plots for a rehabilitation design
for Ranger Uranium Mine, Northern Territory. This
design is an alternative to that illustrated in Fig. 18.1
but is shown from a similar viewpoint (note, for
instance the hill in the centre-left foreground common
to both figures). The figures are: (a) the original design
landform showing the kidney-shaped 25 m high
above-ground structure and a natural hill in the centre
left foreground; (b) the mean erosion depth after 1000
years of Monte Carlo simulations of erosion (vertical
units are metres); (c) the maximum erosion depth after
1000 years of Monte Carlo simulations (vertical units
are metres); and (d) the probability that the erosion
will be greater than 2 m at that point in the domain
(from Morgan, 1994; Willgoose & Gyasi-Agyei, 1995).
(d)
0.833
0.833
0.0
0.0
LEM erosion estimates is important when we dis-
cuss calibration below.
A final component of the work at Ranger was
validation of the predictions of the LEM.
Numerous laboratory model studies have been
carried out to validate the SIBERIA LEM (e.g.
Hancock & Willgoose, 2001a,b, 2002), but only
one model study has looked specifically at the
cap-batter transition type erosion pattern behav-
iour discussed above (Hancock & Willgoose,