Geology Reference
In-Depth Information
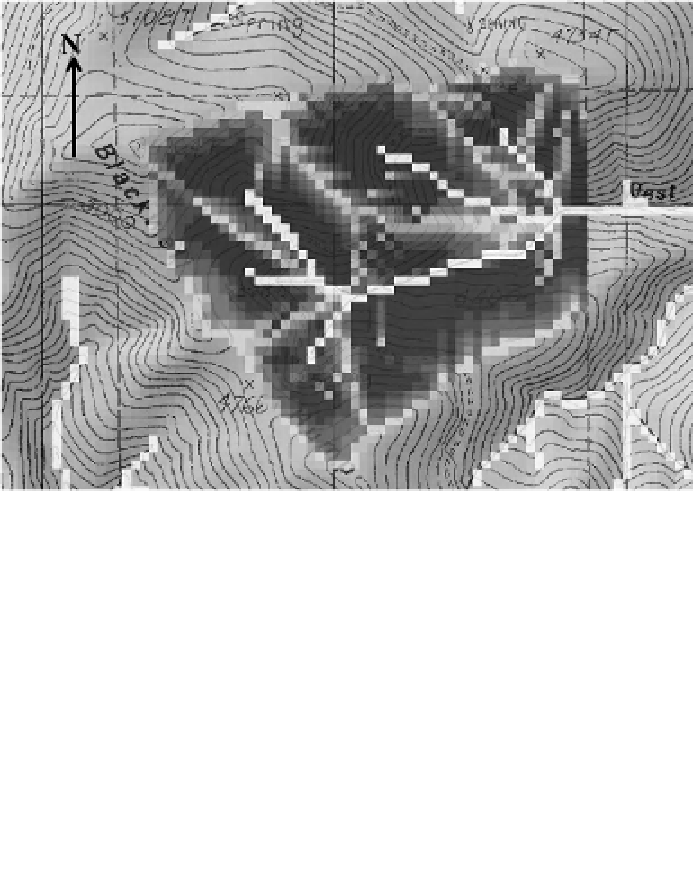
Fig. 16.7
Distribution of on-site
erosion as predicted by GeoWEPP
for Example 16.4, for a year with
the 10-year sediment yield event.
The stream network is white, and
the darker the area, the greater
the predicted erosion. The darkest
areas have a predicted hillslope
erosion rate exceeding 200 Mg
ha
−1
, and the lightest erosion less
than 12.5 Mg ha
−1
. Pixel size is
30 m and the watershed area is
140 ha.
Table 16.3
Return period analysis from GeoWEPP for
Example 16.4. The watershed area was 140 ha.
or GeoWEPP output event files to determine
what year the event occurred. Once the year was
known, then a custom input climate could be
developed containing only the year of interest.
Because of carry-over of snow pack from
November or December in one year to the next, if
the event of interest is during spring snowmelt,
then it may be necessary to include both the year
with the event and the previous year in the cli-
mate file, and run the flowpath method for those
two years only (Example 16.4). The ERMiT tool
uses this approach, running both the year of inter-
est (Fig. 16.4) preceded by the year before.
Daily
precipitation
(mm)
Return
period (years)
Sediment
leaving (Mg)
Peak runoff
rate (m
3
s
−1
)
1
2339
14.8
20
2
3164
18.7
24
5
4618
25.7
27
10
7505
36.2
33
conditions in forested watersheds. For the water-
shed analysis, one of the GeoWEPP output options
is a return period analysis (e.g. Table 16.3).
Carrying out a return period analysis with the
flow path method is more complicated because
the output is limited to hillslope polygon sum-
maries of average annual erosion rates. The
approach by Elliot
et al
. (2006) to apply probabili-
ties to the flow path method was to determine
from a hillslope (or watershed) return period anal-
ysis (Fig. 16.2 or Table 16.3) either the precipita-
tion, runoff or sediment delivery amount for the
desired return period, and then inspect the WEPP
Example 16.4
The DEM for a steep forested
watershed near the Bitterroot Valley, Montana,
was obtained, and a small upland watershed was
identified within that forest for post-wildfire ero-
sion risk analysis. The watershed vegetative cover
was assumed to average 30% following the wild-
fire for this example. Two runs were carried out
for the same climate and soil texture as in the
previous examples. The first analysis was a
50-year run for the entire watershed, using the
'Watershed' option in GeoWEPP.