Geology Reference
In-Depth Information
severity of fire and the distribution of that sever-
ity on the hillslope (Robichaud
et al
., 2007).
Example 16.3
What is the erosion rate from a
single event that would probably be exceeded
once in ten years for the conditions described in
Examples 16.1 and 16.2? The data were entered
into the ERMiT input screen, and a high-severity
wildfire specified.
The ERMiT output screen presents two tables
and a figure. The first table (Fig. 16.4) shows the
individual runoff events selected for the analysis.
The 10-year runoff depth is 18 mm, from 40.9 mm
of precipitation, occurring on 15 May. The sec-
ond output from ERMiT is an erosion exceedance
graph showing the probability associated with a
given erosion rate for each of five years following
the wildfire (Fig. 16.5). The figure shows that
there is a 10% probability that sediment delivery
from a single event will exceed approximately
2.5 Mg ha
−1
in the year following a wildfire. The
final table on the ERMiT output screen is inter-
active, allowing the user to enter the desired
exceedance probability. Once entered, the table
displays the associated sediment delivery rate for
each year following the wildfire and how that
rate is impacted by common erosion mitigation
treatments (Fig. 16.6). This table confirms the
observation in Fig. 16.5, that there is a 10% prob-
ability that erosion will exceed 2.5 Mg ha
−1
on the
example hillslope. It also shows that erosion risk
drops quickly in the following years, similar to
observed data presented in Table 16.1, and that
mulching can be effective at reducing sediment
delivery rates.
The ERMiT model predicted erosion rates
similar to those observed on a small watershed
(Table 16.1) and lower than those observed from
silt fence plots (Table 16.1 silt fence plots, and
Table 16.2) and predicted by the Disturbed WEPP
interface. This is probably because the silt fence
plots were located on a site where there were only
high-severity fire conditions, and examples 16.1
and 16.2 modelled those conditions. ERMiT,
however, considers a hillslope as a mosaic of fire
severity, and internally is designed to consider a
range of hillslope severity conditions in its
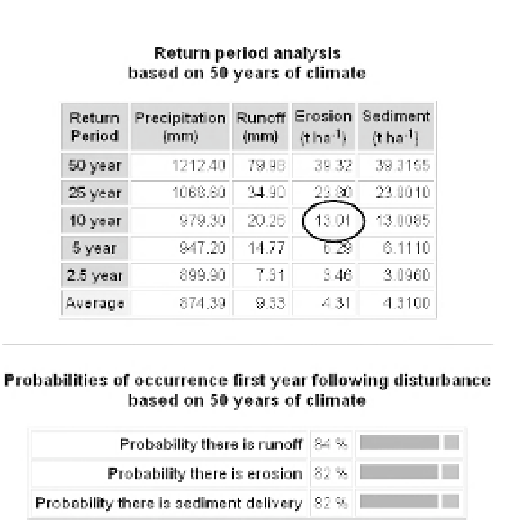
Fig. 16.3
Return period analysis from the Disturbed
WEPP online interface output screen for Example 16.2.
associated with these interfaces (WEPP Windows
was version 2008.907 and Disturbed WEPP ver-
sion 2001.100) and differences in input files
describing vegetation. Figure 16.3 shows that the
average predicted erosion rate for these condi-
tions is 4.3 Mg ha
−1
, compared with 0.55 Mg ha
−1
from the WEPP Windows interface. Because of
the skewed distribution of erosion events, obser-
vations of erosion rates need to be interpreted
with care as erosion rates well below an average
value are likely to be observed, while it is still
possible to observe a greater than average erosion
rate (Robichaud, 2005). As burned sites can
quickly recover, only data collected the first year
following a wildfire should be used to compare
with these predicted values (Table 16.1).
The second online interface that incorporated
probability into erosion prediction is the Erosion
Risk Management Tool (ERMiT) (Robichaud
et al
., 2007). ERMiT predicts the probability of
exceeding a given sediment delivery amount
following a wildfire for a single event, and also
estimates the benefits of several practices to
reduce erosion risk. ERMiT considers not only
variability in climate, but also variability in