Geology Reference
In-Depth Information
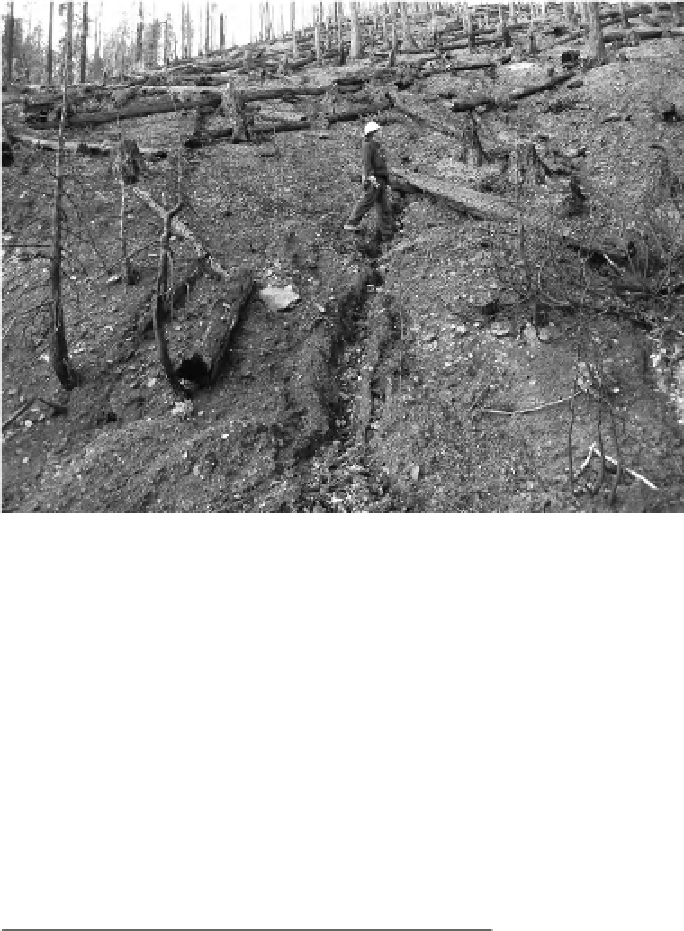
Fig. 16.1
Scientist inspects
the erosion occurring after a
wildfire in northern California,
US 2(photography courtesy of
Natalie Copeland 2008).
Table 16.1
Observed annual erosion rates for three
years following wildfires on three sites in the
western US.
Table 16.2
Observed erosion rates (Mg ha
−1
) from 20 m
long plots in 2001 following the 2000 Bitterroot Valley
Fire in Montana (Robichaud
et al
., 2008a).
Erosion (Mg ha
−1
)
Plot
15-Jul
21-Jul
30-Jul
14-Sep
Total
Year
of fire
Type of
plot
Site
Year 1 Year 2 Year 3
A
2.9
20.9
0.09
0.06
23.9
F
17.9
-
0.08
0.03
18.0
Wallowa-Whitman
National Forest,
Oregon
a
1994
Silt fence
1.9
0.1
0.03
I
0.33
8.4
0.23
0.08
9.0
N
0.13
15.8
0.25
0.02
16.2
Average
5.30
15.01
0.16
0.05
16.8
Silt fence
b
29
0.8
0.07
Pcp, mm
a
6.6
15.7
22.1
3.8
Bitterroot National
Forest, Montana
2000
Small
watershed
c
0.64
0.93
0.09
I-10, mm h
−1
b
19.8
39.6
7.6
13.7
a
Total storm precipitation;
b
maximum 10-minute precipitation
intensity of storm.
a
Robichaud & Brown (1999);
b
Robichaud
et al
. (2008a);
c
Robichaud
et al
. (2008b).
rate. If the precipitation is moderate, then erosion
will probably be minimal. If the weather has storms
or snowmelt rates that are above normal, then ero-
sion can be severe. In the study summarized in
Table 16.2, maximum precipitation intensity was
more important than total precipitation amount at
causing erosion. In other studies (e.g. Robichaud
et al
., 2008b), total precipitation amount was more
important than intensity in causing erosion.
In order to address erosion for disturbance-
dominated conditions, an average annual value
is of limited utility since the disturbed condi-
tions are not average, and erosion following the
disturbance is dependent upon the degree of the
disturbance, the distribution of the disturbance,
the weather immediately following the distur-
bance and the rate of vegetation and soil recov-
ery. For these disturbed conditions, a risk-based