Geology Reference
In-Depth Information
000811
0
20
40
60
80
100
120
140
160
180
200
250
P
Q-simulated LISEM 163
Q-measured
Q-simulated LISEM LP
200
150
100
50
0
0
20
40
60
80
100
Time (minutes, 0 = 18:25)
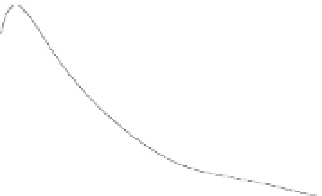
000829
0
20
40
60
80
100
120
140
160
180
200
10000
9000
P
Q-simulated LISEM 163
Q-measured
Q-simulated LISEM LP
8000
7000
6000
5000
4000
3000
2000
1000
0
0
20
40
60
80
100
Time (minutes, 0 = 21:36)
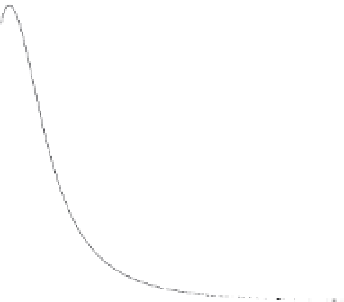
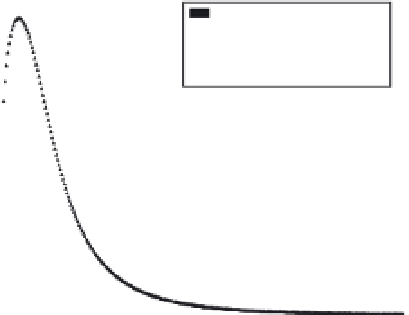
Fig. 12.5
cont'd.
before the water can advance further. Furthermore,
it seems likely that in that case, infiltration of
channel flow could be important. This process is
not simulated in either of the LISEM versions used
here, but has been added to later versions.
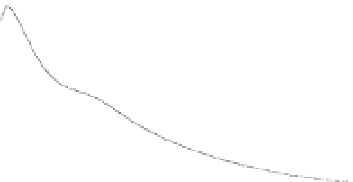
Simulated total discharge was always too high
when LISEM was calibrated on peak discharge
(Table 12.6). Figure 12.5 shows that LISEM was gen-
erally unable to predict accurately the very rapid
rise and fall of water level that occurred in reality.
This was especially the case for the smaller events.
was for LISEM 163. As shown in Section 12.6.2,
this is mainly due to the slope correction that
has been applied. Comparison of the calibrated
hydrographs of LISEM 163 and LISEM LP shows
that for most events the runoff peak arrived a lit-
tle later, although still before the measured peak.
The overall fit was usually similar, because the
predicted water level also tended to decline a lit-
tle less rapidly. This shows that using a model
that is theoretically better does not guarantee
that the prediction will also be better. Never-
theless, the Nash-Sutcliffe coefficient was higher
for four out of five events (Table 12.7). This
was mainly due to the fact that the time shift
(ii) LISEM version
In LISEM LP, calibrated sat-
urated conductivity was always lower than it