Geology Reference
In-Depth Information
1200
4000
3500
1000
3000
C-measured
C-Govers (1990)
800
C-Low (1989)
C-Yalin (1963)
2500
C-Yang (1973)
Q-simulated
2000
600
1500
400
1000
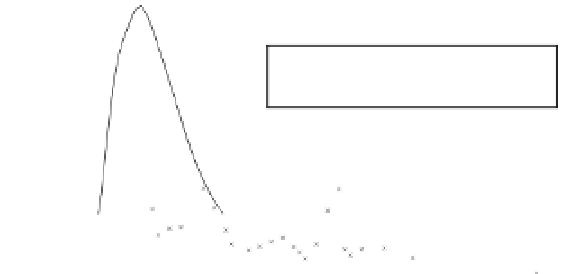
Fig. 12.4
Measured and
predicted sediment
concentrations using
different transport
equations.
200
500
0
0
0
20
40
60
80
100
Time (minutes; 0 = 13:30)
concentration was restricted to 1060 g l
−1
because
higher concentrations were assumed to be phys-
ically unrealistic. This restriction affected most
results considerably (e.g. the Yang equation), but
the effect of the restriction on the results
obtained with the Govers equation was small.
Thus, the equation that is at present being used
by LISEM was found to perform best and was
therefore used in this study.
sediment showed only a small decline in loose
material. This can be explained by the fact that
many of these pixels did not experience much
runoff because they had fairly small upstream
areas. The results indicate that including a loose
material map is likely to have more effect when
the loose material is present close to the outlet of
the catchment.
(v) Particle fall velocity
The settling velocity
correction resulted in an increase of predicted
sediment concentrations during the runoff peaks,
but not at other times. The result was slightly
unexpected since the settling correction could be
expected to slow down settling after the sediment
peak. This would result in higher concentrations
after the sediment peak. The overall predicted
increase in sediment yield seems reasonable.
12.6.3
Calibration and validation
(i) Results for peak discharge calibration
Table 12.5
shows the calibrated values of LISEM input param-
eters for all five events, both for LISEM 163 and for
LISEM LP. It shows that the calibration gave differ-
ent results for the different storms. Figure 12.5
shows the measured discharge as well as the cali-
brated discharge for each of the events, while
Table 12.6 gives a summary of the simulation
results. These calibration results show a number of
features that are common to most events, as well
as some features that were event-specific.
(vi) Loose material map
The results showed
that in some places a considerable amount of
material was removed. For the entire catchment
the amount of loose material declined from 372
to 265 tonnes, so that 107 tonnes of loose sedi-
ment was taken up by the flow. Nevertheless, the
total amount of sediment leaving the catchment
only increased by 1-2 tonnes. The extra eroded
sediment is deposited before reaching the
catchment outlet, as shown by the deposition
map produced by LISEM. Most pixels with loose
Saturated conductivity
: Calibrated saturated
conductivity was always much lower than the
measured values. A possible explanation for this
would be disturbance during sampling. Soil seal-
ing/crusting could also be important. The effect
of sealing/crusting is hard to measure on samples
taken from the field. It is also possible that in the