Geology Reference
In-Depth Information
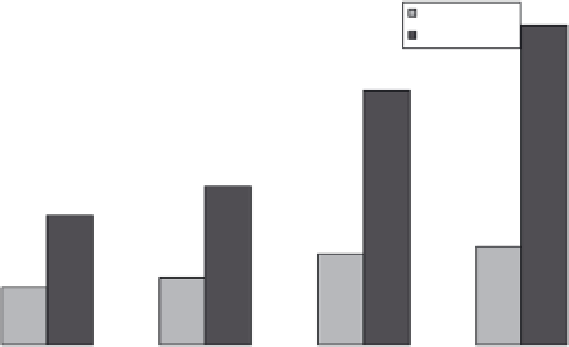
Runoff - l (Measured and WEPP)
(l)
50000
45000
Measured
WEPP
40000
35000
30000
25000
20000
15000
10000
5000
Fig. 10.1
Runoff (l):
comparison of measured
values and those predicted by
WEPP.
0
L20S1
L20S7
L40S1
L40S7
Segments
40 m slope, most runoff occurred during the
62.9 mm event on the 1% slope, and during the
68.5 mm event on the 7% slope. On the 40 m
slope, the highest soil loss occurred during the
67.2 mm rainfall event on the 1% slope, and dur-
ing the 61.0 mm rainfall event on the 7% slope.
As runoff amount increases, runoff velocity
also increases, favouring sediment transport.
Therefore, the amount of soil loss augments
exponentially, due to runoff enlargement. This
occurred in all treatments, although Garcia (2001)
noticed that slope steepness had more influence
on soil loss than slope length. However, slope
length variations had more influence on runoff
amount than slope steepness.
The total amount of precipitation was used to
estimate runoff and soil loss amount using WEPP
(Fig. 10.1). Runoff amount predicted by WEPP on
the 20 m long and 1% slope, 20 m and 7%, 40 m
and 1%, and 40 m and 7% slopes varied by 120.8,
140.0, 181.5 and 224.1%, respectively, in relation
to the monitored measurements (Table 10.2).
The total amount of soil loss on the slopes of
20 m length and 1% angle, 20 m and 7%, 40 m
and 1%, and 40 m and 7%, varied by
Fig. 10.2). These differences confirm the need for
the calibration of model variables, since the soil
and climate files were adapted for the experimen-
tal site.
The model did not prove satisfactory, showing
soil-loss prediction to be much less than the
actual measurements on the experimental site for
the 1% slope. Garcia (2001) suggested that on
such gentle slopes the model might underesti-
mate soil loss, which agrees with the observa-
tions of Martins Filho
et al
. (2003). On the other
hand, soil-loss data predicted by WEPP were
higher than but also closer to the observed data
on the 7% slope, despite the difference of 166.6%
between the actual and predicted data (Garcia,
2001).
Figure 10.3 shows the percentage variations
between the observed and predicted values of
runoff and soil loss. The negative values indicate
that the model underestimated measured values
only for soil loss on the 1% slope, whereas for
the 7% slope, the model overestimated meas-
ured values. For runoff, in all situations, the
model overestimated measured values. This
shows that WEPP cannot always accurately pre-
dict soil loss. For runoff, although WEPP overes-
timated measured values, there was general
−
1,125.1,
−
724.6 and 120.8%, respectively, compared
with the monitored measurements (Table 10.2;
6.7,
−