HTML and CSS Reference
In-Depth Information
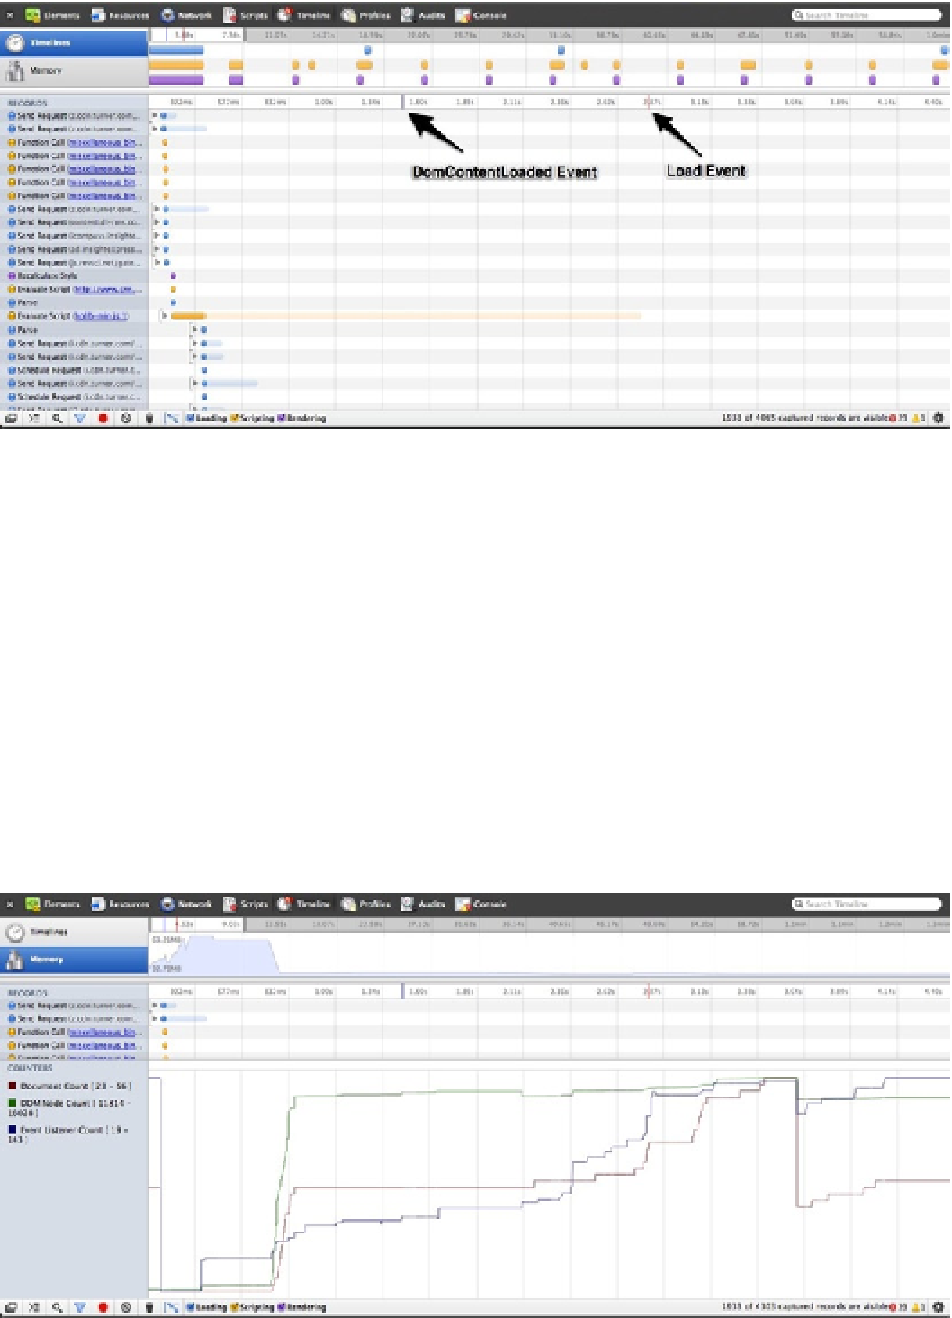
Figure 10-4.
The browser's timeline inspector
As you can see, a lot of things happen when you hit Enter after you type in the URL. In the example, you see
anything from HTTP requests and the time they take to respond, function calls within the script files, and even
repaints and rendering to the DOM. Also, more importantly, you can even see what ads are doing on the page you're
inspecting. What's really useful is that you can inspect when the DOM events “content loaded” and “load” fire and
get a better assessment of the page's optimization before you need to dig into ad-specific optimizations. In this case,
it took just shy of 1.6 seconds to fire
DOMContentLoaded
and about 2.8 second to fire the
Load
event. This is important
to an ad server because the server would generally want to listen for one of these events and serve the ad after the
main content is rendered to the screen. This way you can determine if the page needs to be better optimized, your ad
content or both.
In addition to the “waterflow” view in your timeline, you can also inspect the memory being used to render the
page contents including DOM markup, styles, scripts, and even ads. Figure
10-5
shows what the memory section
would look like when you request the same page.
Figure 10-5.
Browser's memory usage