HTML and CSS Reference
In-Depth Information
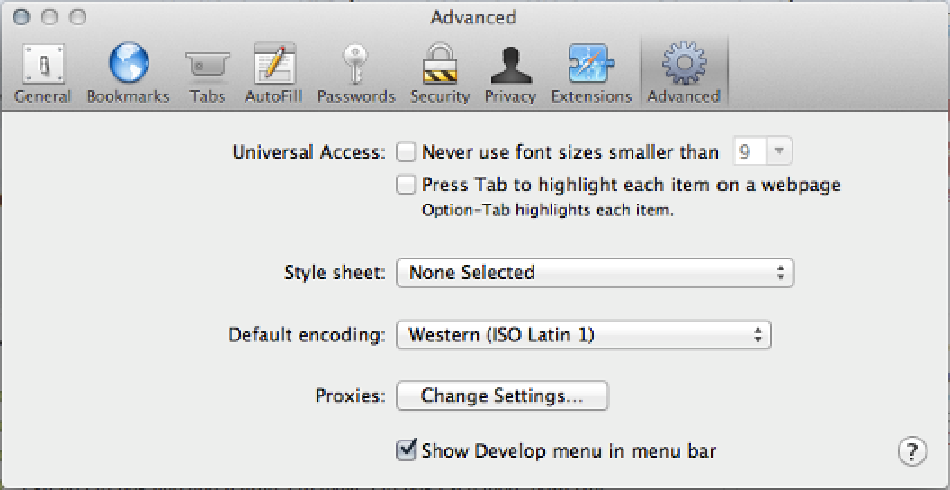
Figure 10-2.
Safari's Develop menu setting
In addition to the popular Web Inspector, there is also a browser extension called Firebug that essentially does
similar things and provides developers with similar tools for debugging web content on various browsers. To learn
more about Firebug, visit
http://getfirebug.com
.
Firefox also has recently updated its Web Inspector to view content
in 3D. This is incredible helpful if you need to understand the stacking order of elements and determine whether
certain elements lay on top of others
Development Tools
If you've been a developer for any amount of time in your life, you know how much time can be dedicated to the art
and process of debugging code. If you're new to development, trust me when I say, “Get used to things not working
and start learning to figure them out.” Patience is a key trait in debugging, along with having the right tools, workflow,
and techniques. In this section, I'll review some really great tools to use that are free and some amazing techniques
that will give you the edge over your competition when debugging for multiple platforms and devices.
Developer tools are plentiful on the Web. Just Google any web development tool, and you'll see many results.
A few of my favorite online tools are JSConsole (
http://jsconsole.com
) for debugging JavaScript on mobile
devices, JSBin (
http://jsbin.com
)
for quickly mocking up and sharing code with friends and collegues,
JSBeautifier (
http://jsbeautifier.org
)
for cleanly unminifying libraries and code for readability, and RemoteTilt
(
http://remote-tilt.com
) for working with motion events outside of the native device. Remy Sharp, developer extra-
ordinaire, has created all of these tools except for JSBeautifer, and I've personally used them all on countless campaigns
while debugging my ad content. Other very useful tools include DomMonster (
http://mir.aculo.us/dom-monster
),
YSlow (
http://yslow.org
)
, and PageSpeed (
http://developers.google.com/speed/pagespeed
)
, all of which allow
for debugging and optimizing your web content.
One of my absolute favorites is an HTTP monitoring tool. These types of tools capture and log all the HTTP traffic
that happens in your browser. For example, if you have an ad that's making many HTTP requests and calling external
services, this tool can be very valuable to give you a view into what's really going on under the “hood.” Some of these
tools are Charles (for Mac) (
http://charlesproxy.com
)
and Fiddler (for PC) (
http://fiddler2.com/fiddler2
), and

