Environmental Engineering Reference
In-Depth Information
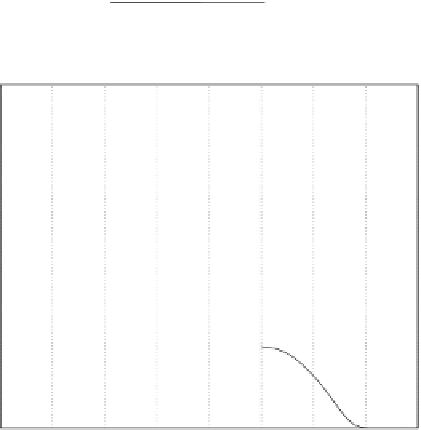
Fig. 2.3
Adjoint functions
g
ij
0.015
r
j
,
)
corresponding to zone
=
g
i
(
t
g
11
ʩ
1
0.0125
(
when they are
restricted to the optimal
discharge points
r
j
(
i
=
1
)
0.01
j
=
1
,
2
,
3
)
0.0075
0.005
0.0025
g
12
g
13
0
0
0.5
1
1.5
2
2.5
3
3.5
4
t
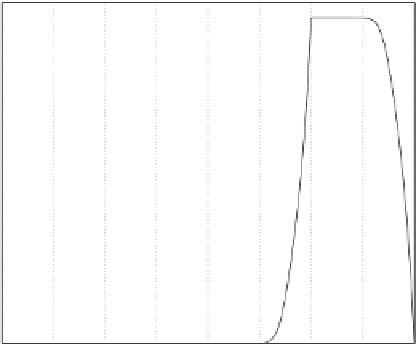
Fig. 2.4
Adjoint functions
g
ij
0.01
r
j
,
)
corresponding to zone
=
g
i
(
t
0.009
g
22
ʩ
2
(
when they are
restricted to the optimal
discharge points
r
j
(
i
=
2
)
0.008
0.007
j
=
1
,
2
,
3
)
0.006
0.005
0.004
0.003
g
21
0.002
0.001
g
23
0
0
0.5
1
1.5
2
2.5
3
3.5
4
t
A similar result follows from Fig.
2.5
, since the adjoint functions
g
31
and
g
32
are
almost zero in the time interval
, and therefore the discharge of nutrients at
points
r
1
and
r
2
practically has no influence on its concentration in zone
[
2
.
25
,
4
.
0
]
ʩ
3
. However,
it follows fromFig.
2.4
that function
g
21
is positive in the time interval
[
2
.
25
,
4
.
0
]
, and
hence, the discharge of nutrient at point
r
1
ʩ
2
,
as it was expected. Finally, the temporal behaviour of adjoint function
g
23
allows us
to conclude that the discharge at point
r
3
does not affect the concentration of nutrient
in
influences its concentration in zone
ʩ
2
.
Thus, the polluted zones are not independent with respect to the dispersion process,
since the release of nutrient in a particular zone can affect the concentration in


Search WWH ::

Custom Search